Graphing Calculator Drawing: Parabolas
Parabolas can be used to draw a fish.
This post is part of the book Graphing Calculator Drawing Exercises. Suggested citation: Skycak, J. (2019). Graphing Calculator Drawing: Parabolas. In Graphing Calculator Drawing Exercises. https://justinmath.com/graphing-calculator-drawing-parabolas/
Want to get notified about new posts? Join the mailing list and follow on X/Twitter.
Setup. Navigate to https://www.desmos.com/calculator. Be sure to sign in so that you can save your graph.
Demonstration - Parabola. Observe the graph as you type each of the following inputs. In general, an absolute value graph $y=mx^2$ makes a “U” shape, with the magnitude of $m$ controlling the slope of the U, and the sign of $m$ controlling whether the U opens upward or downward.
Demonstration - Shifts. Observe the graph as you type each of the following inputs. In general, the graph of $y=m(x-a)^2+b$ shifts the absolute value graph $y=mx^2$ so that the hump of the “U” occurs at the point $(a,b).$
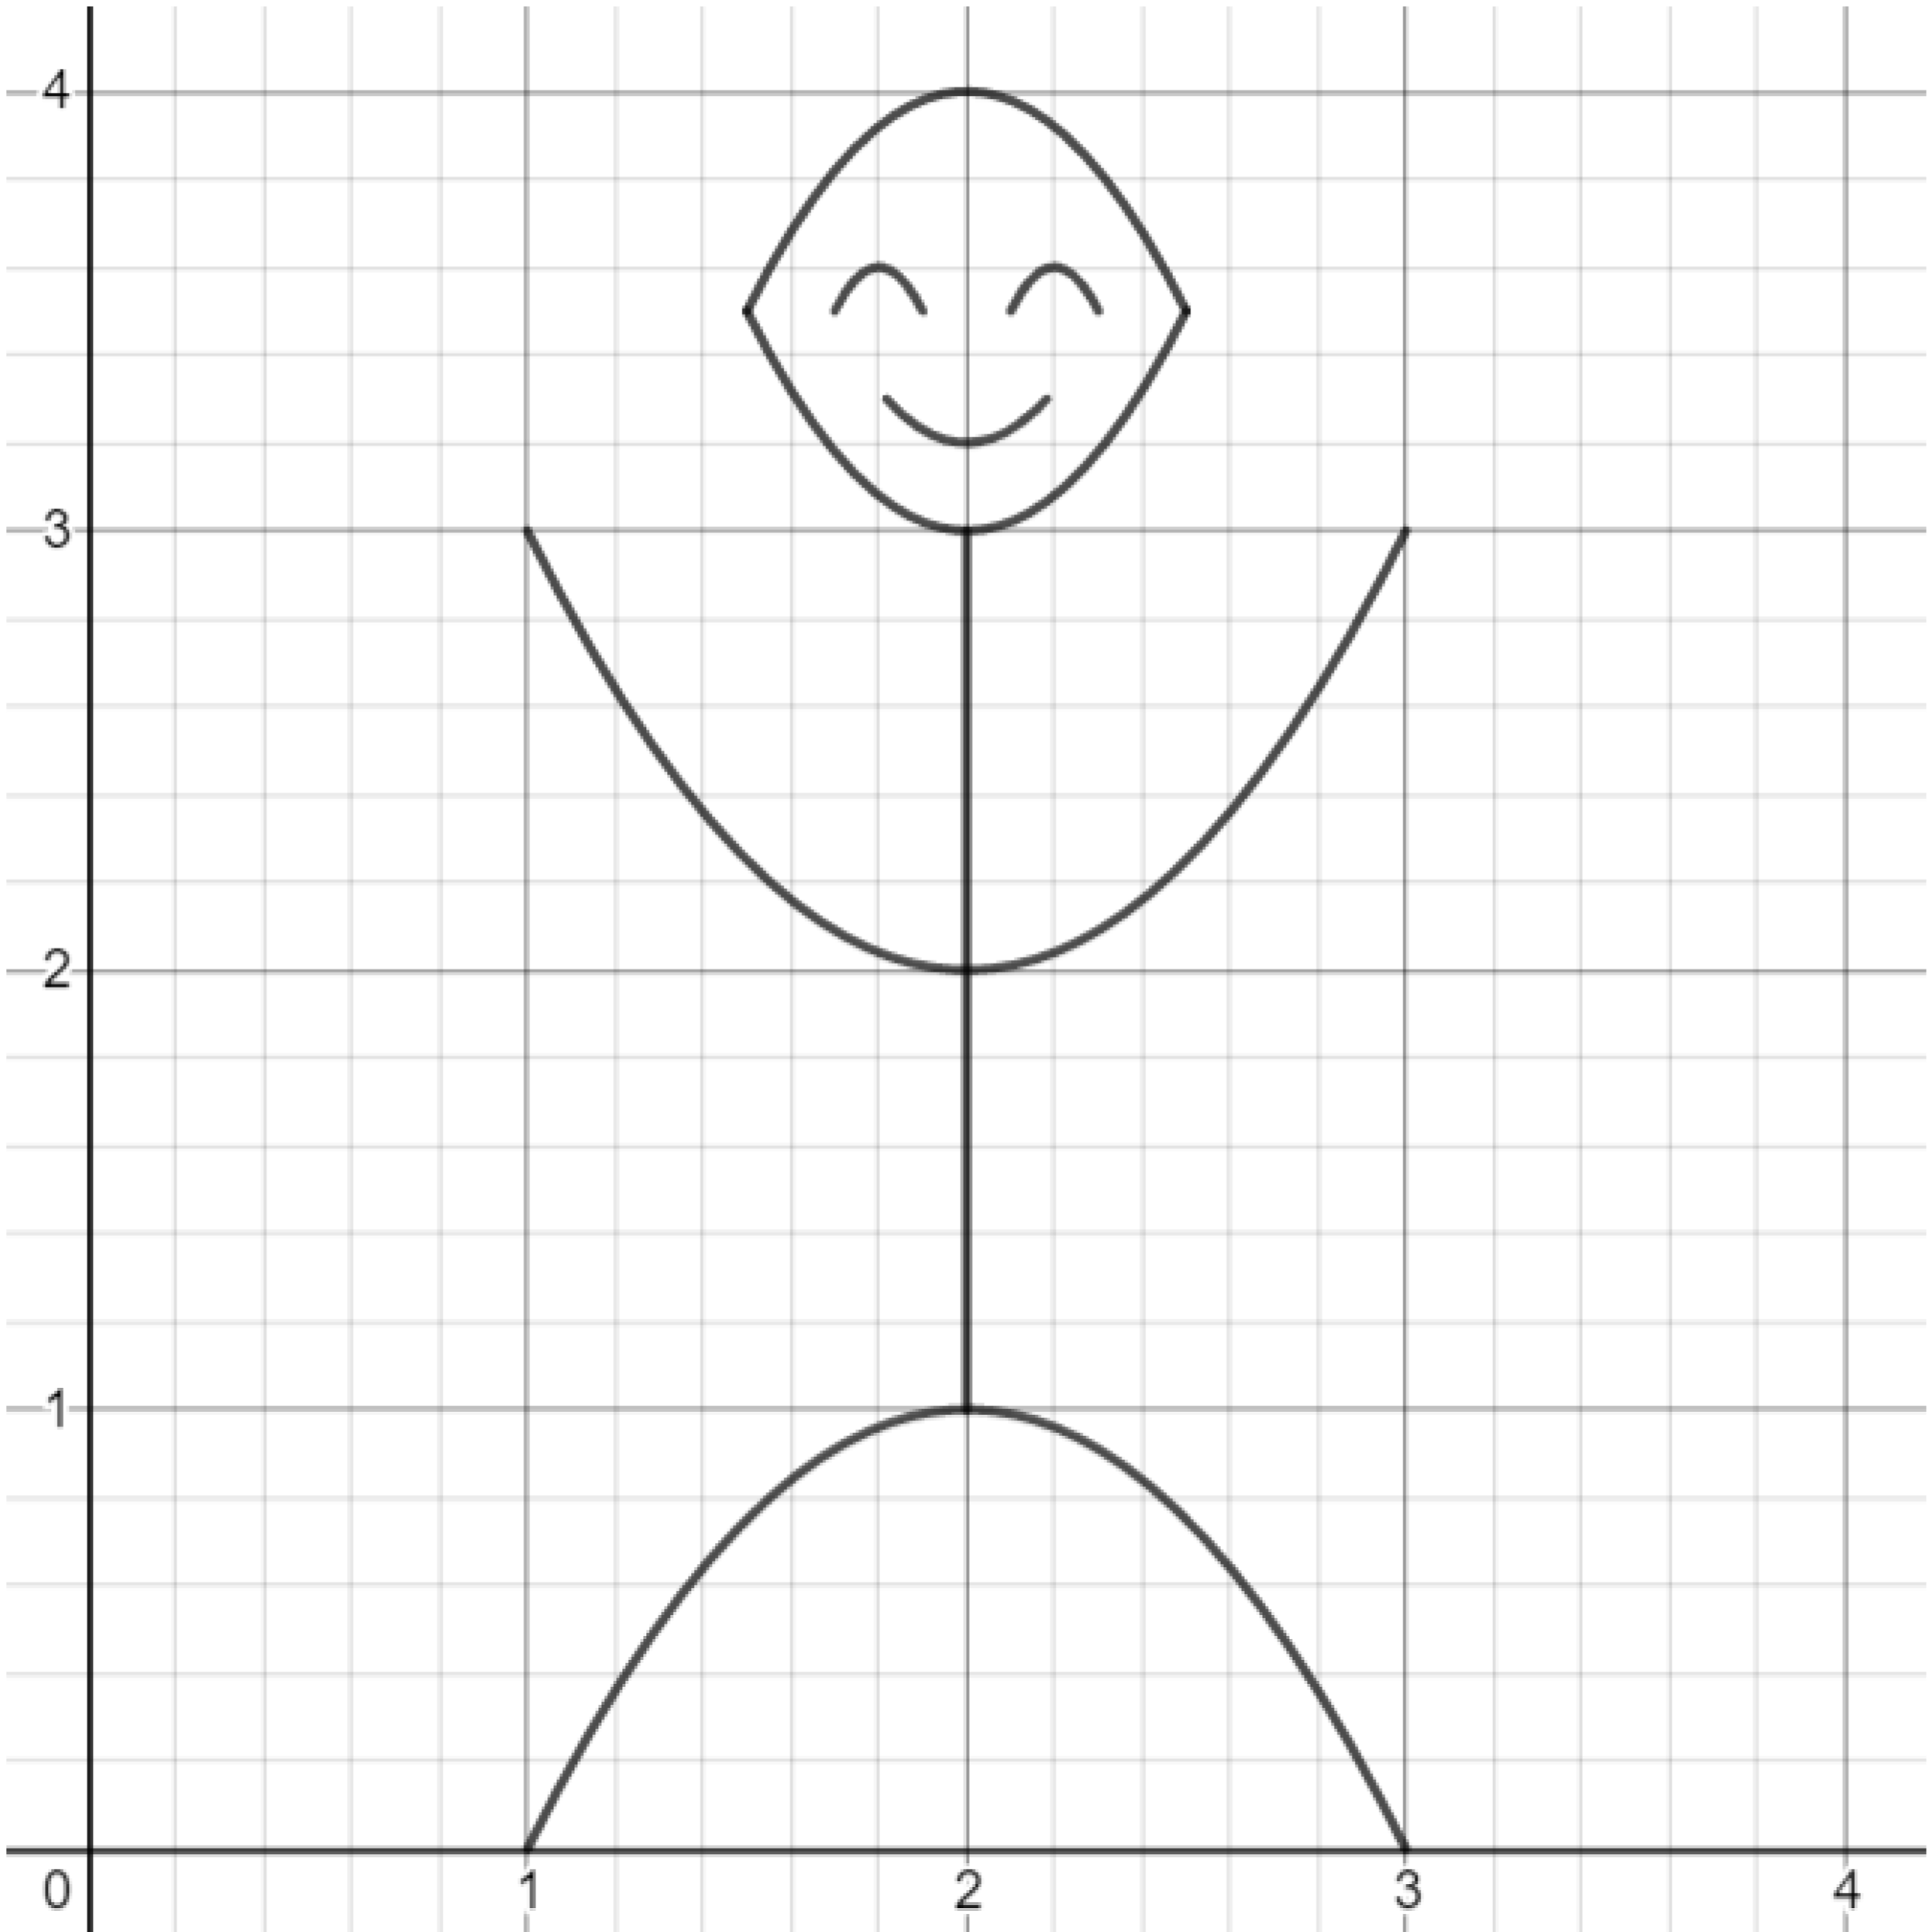
Exercise. Previously, you used absolute value functions to create a person. This time, draw the person using parabolas!
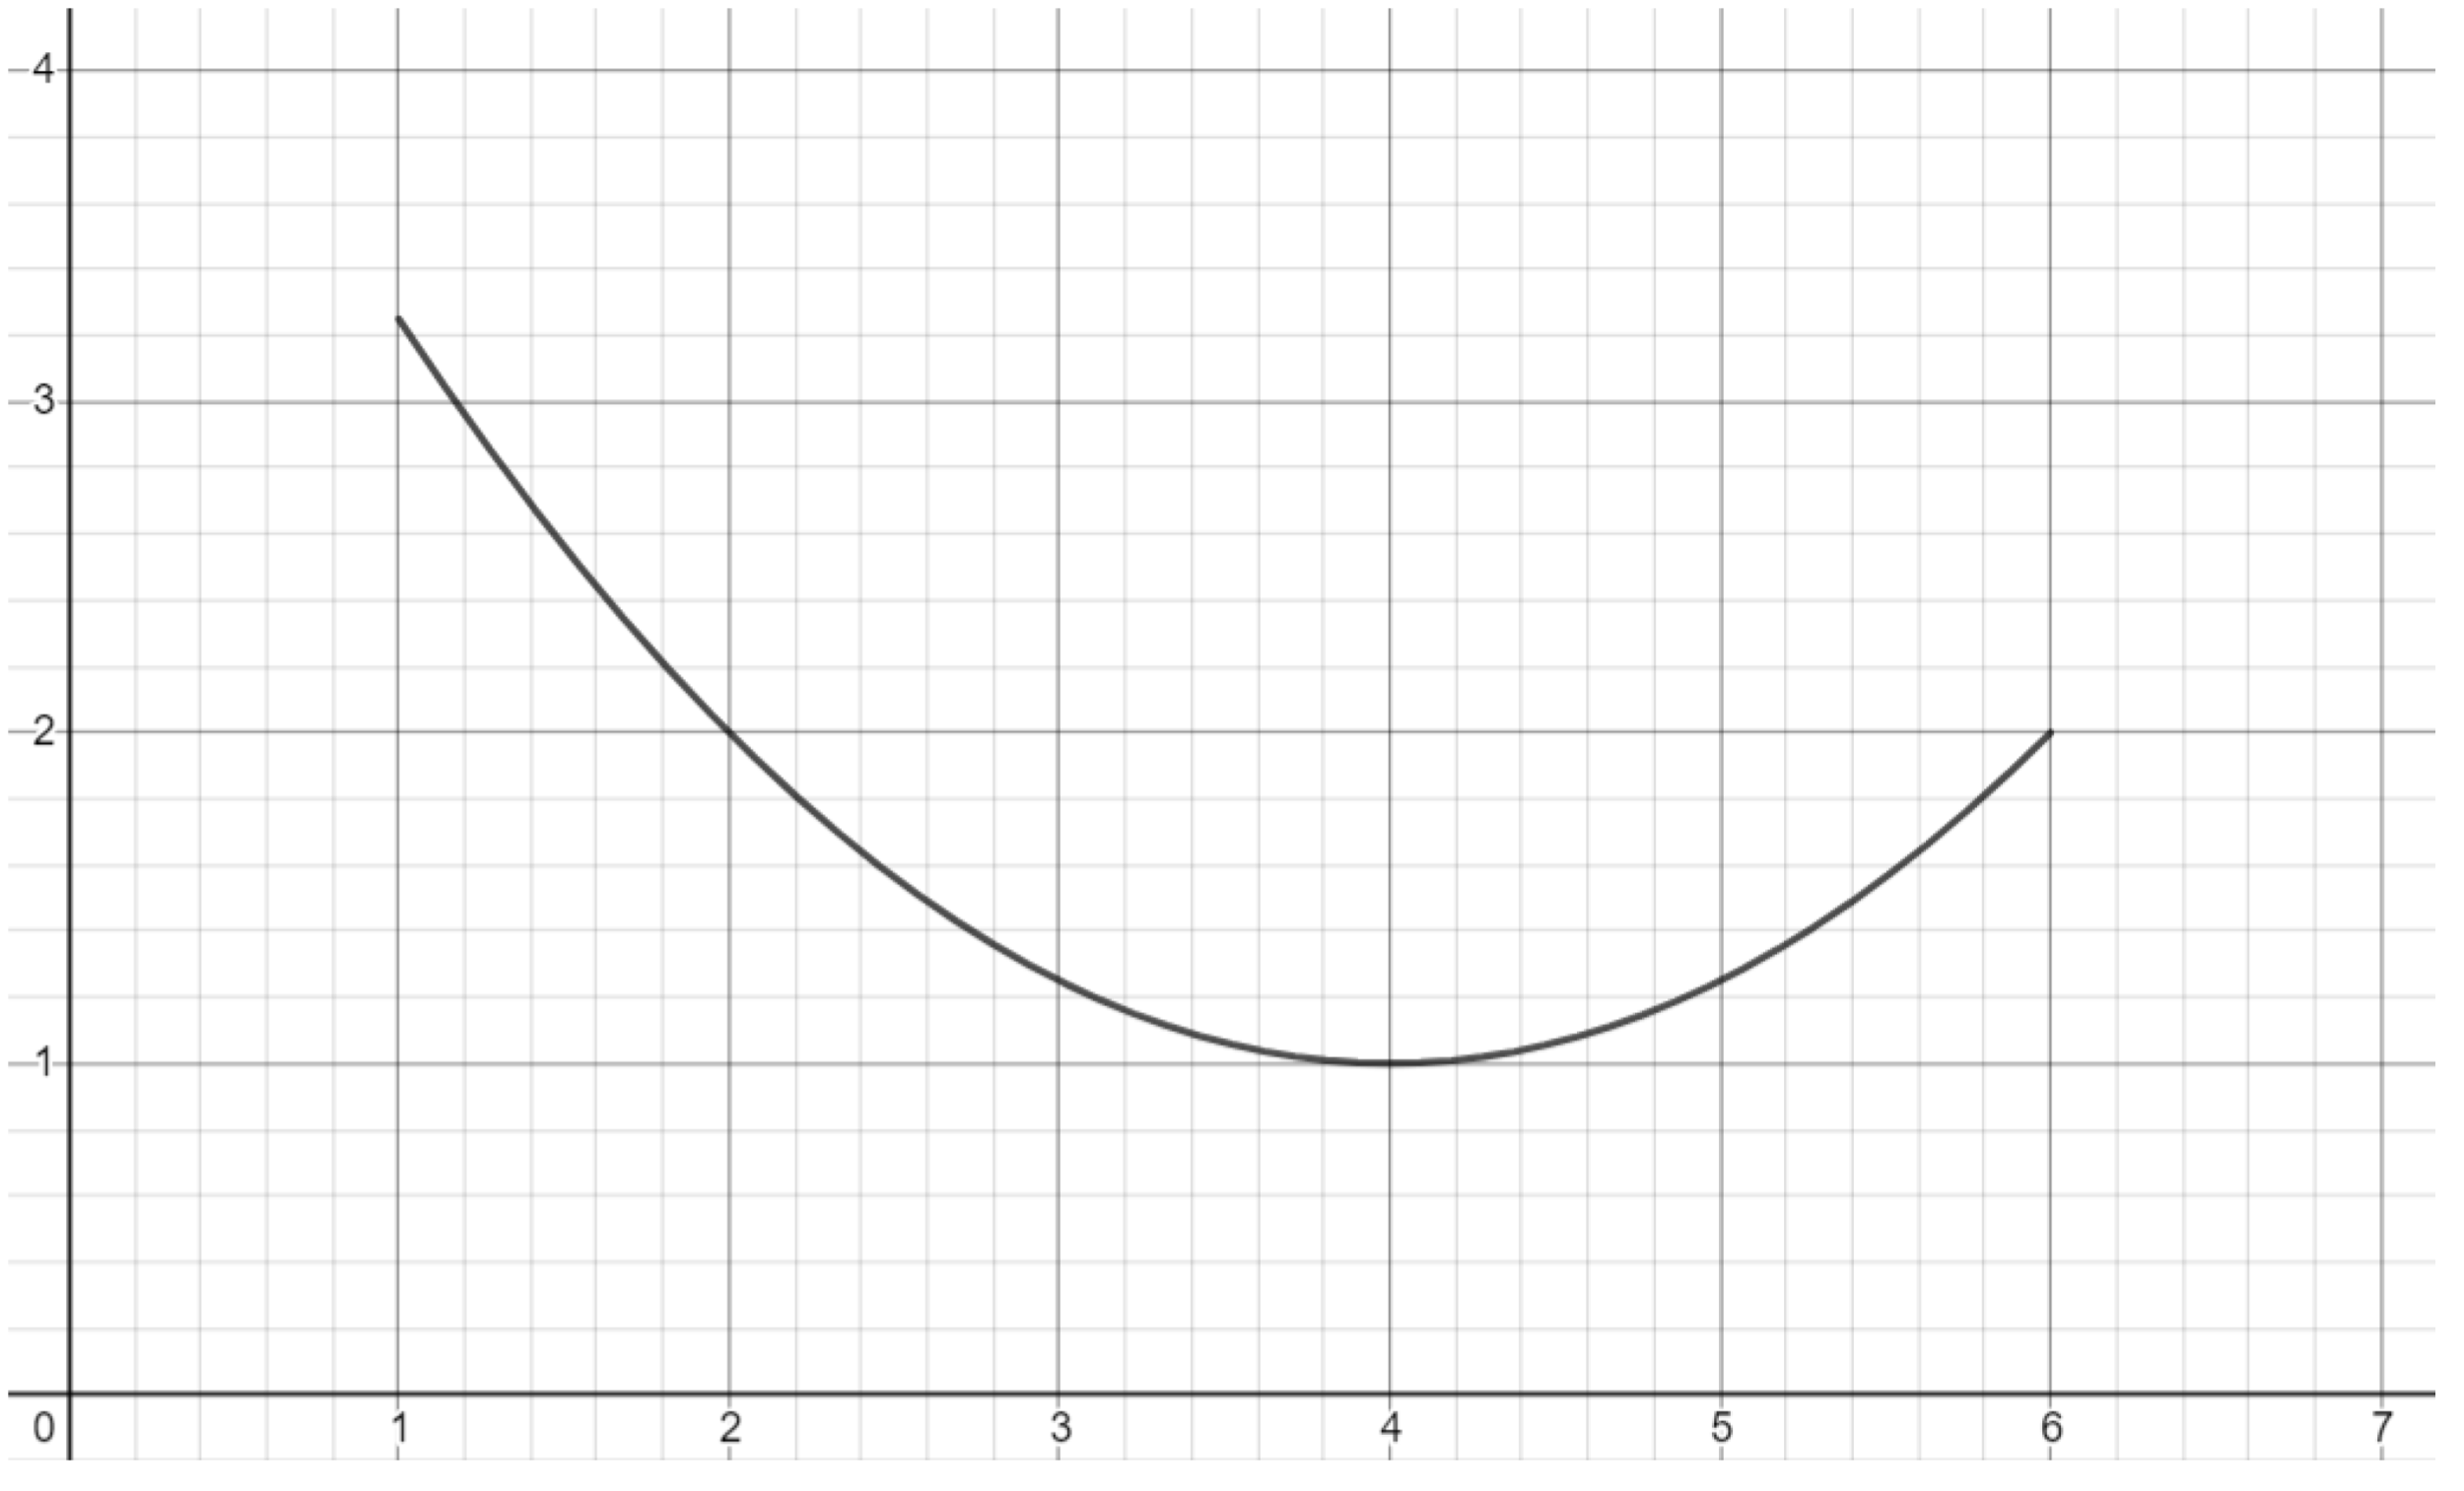
Exercise. Draw the portion of the parabola shown below.
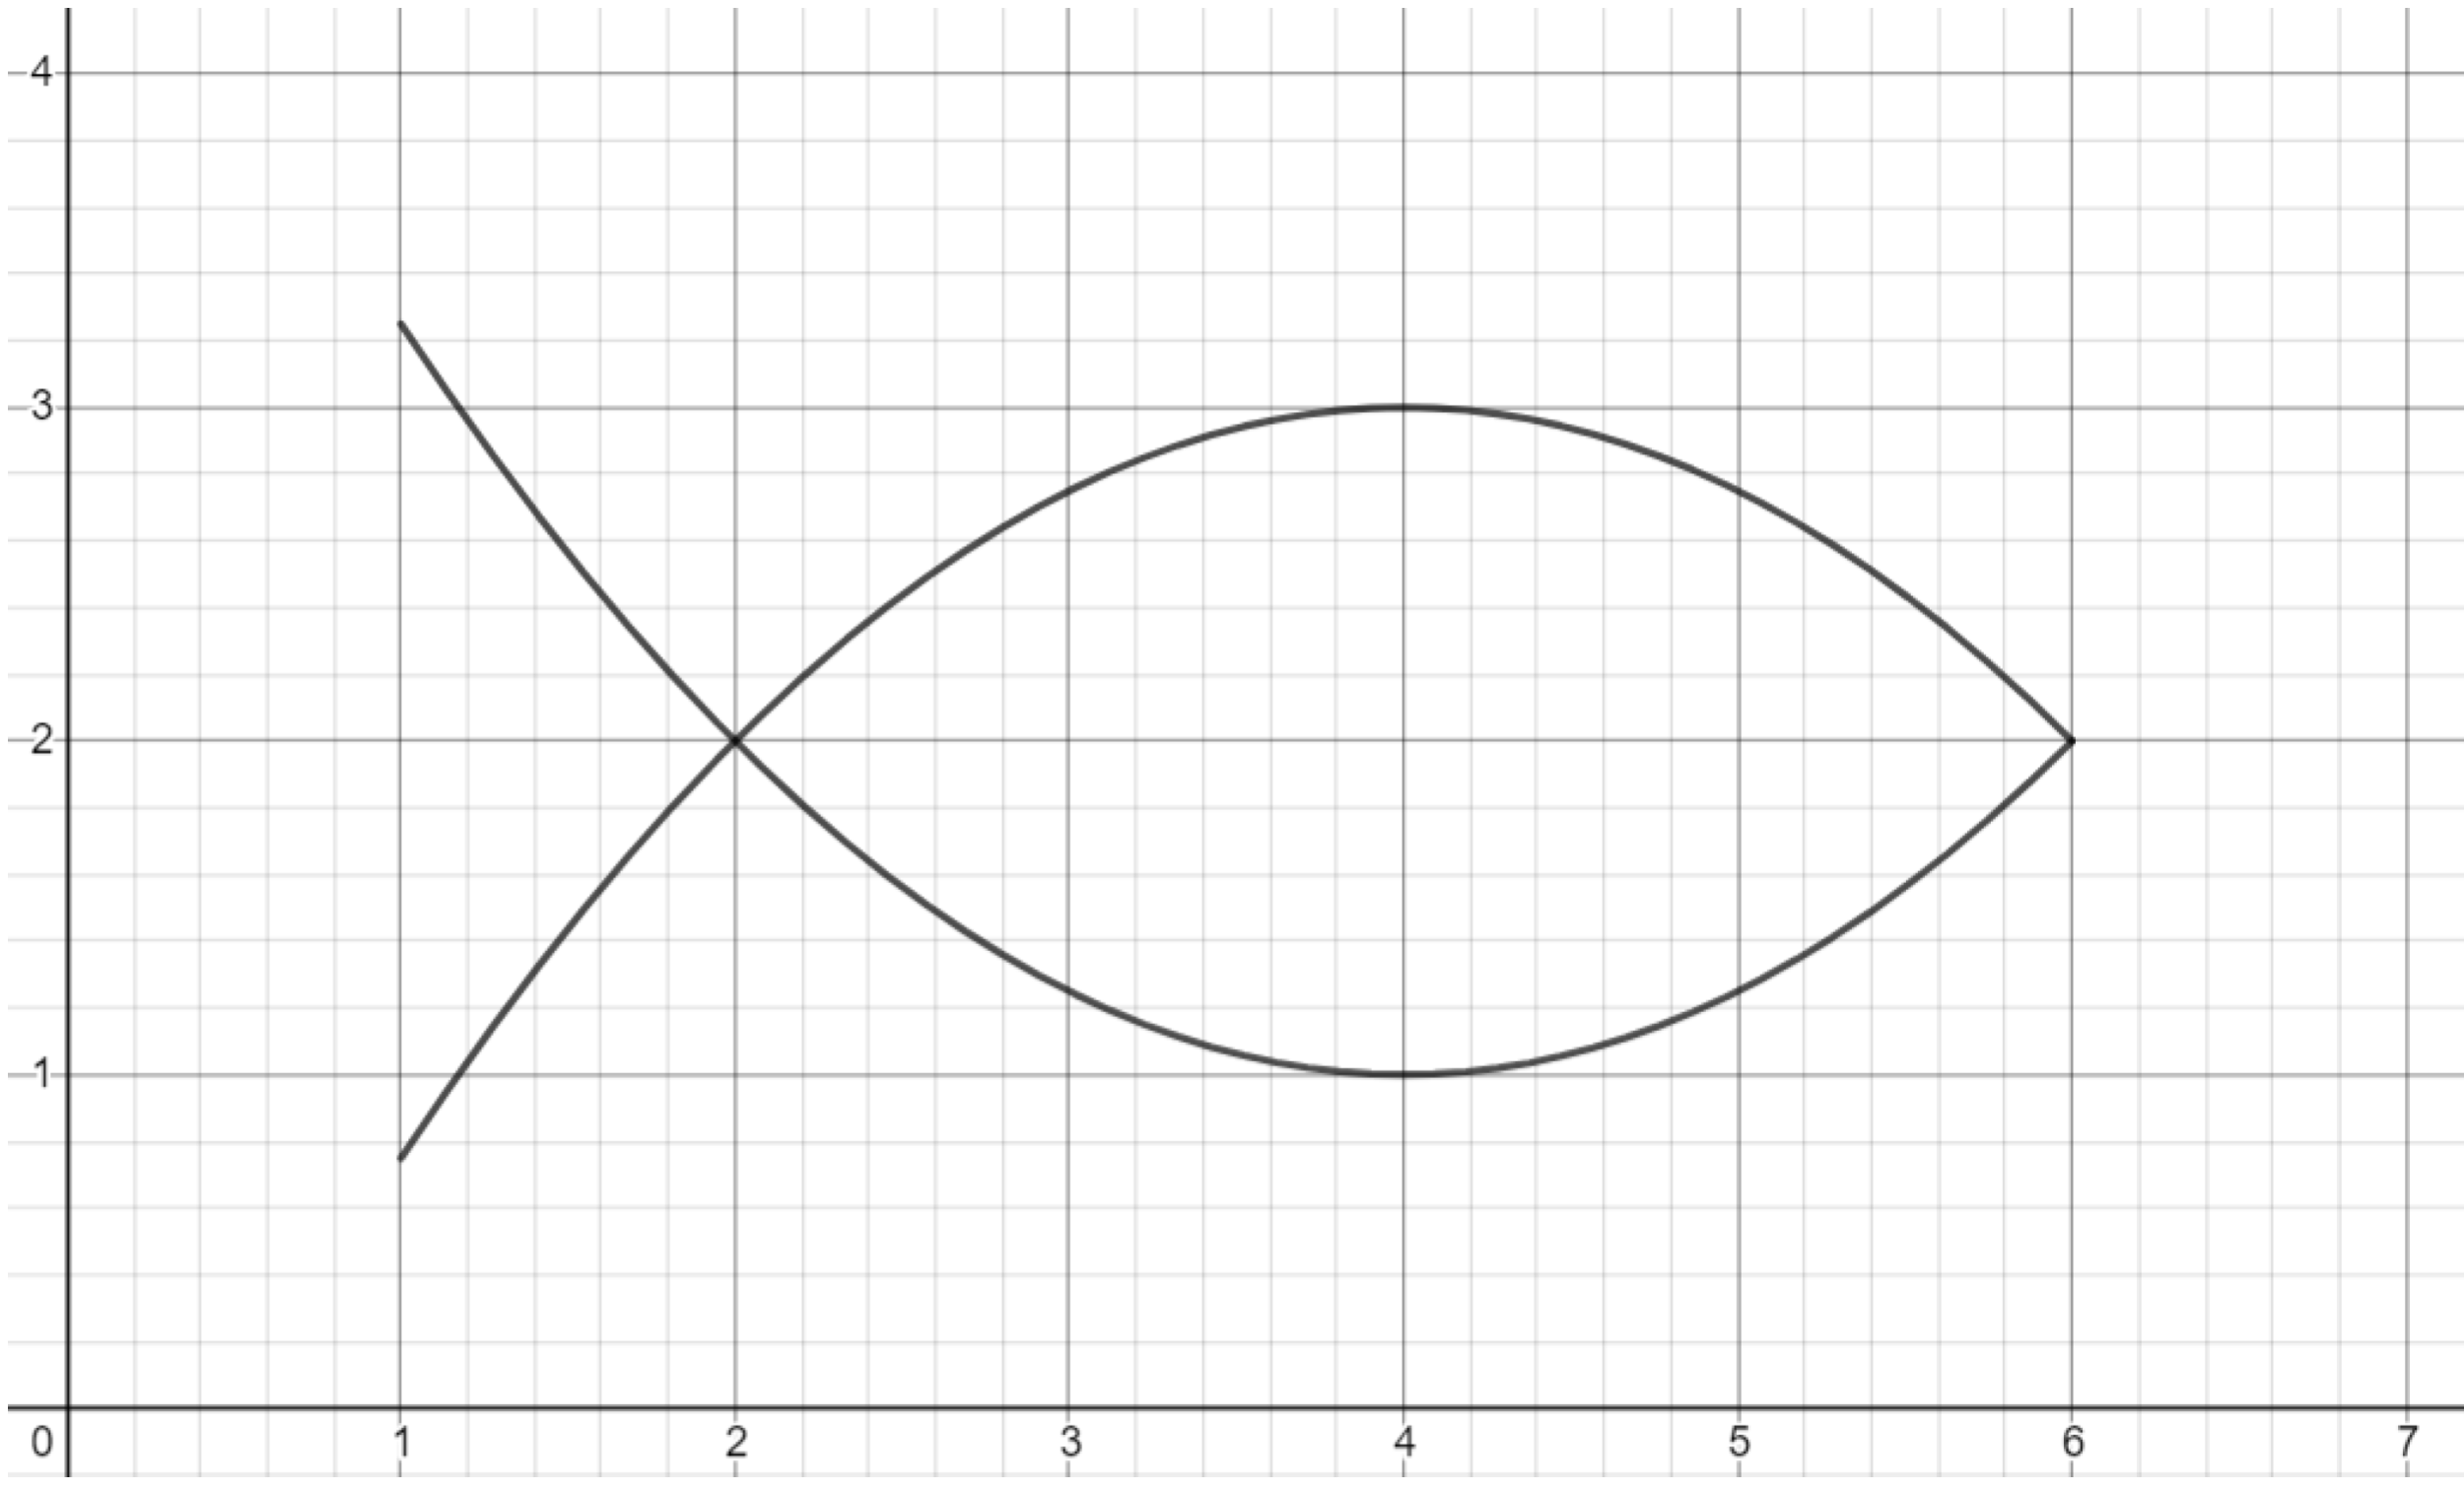
Exercise. Reflect and shift a copy of the parabola portion drawn previously to form an outline of a fish.
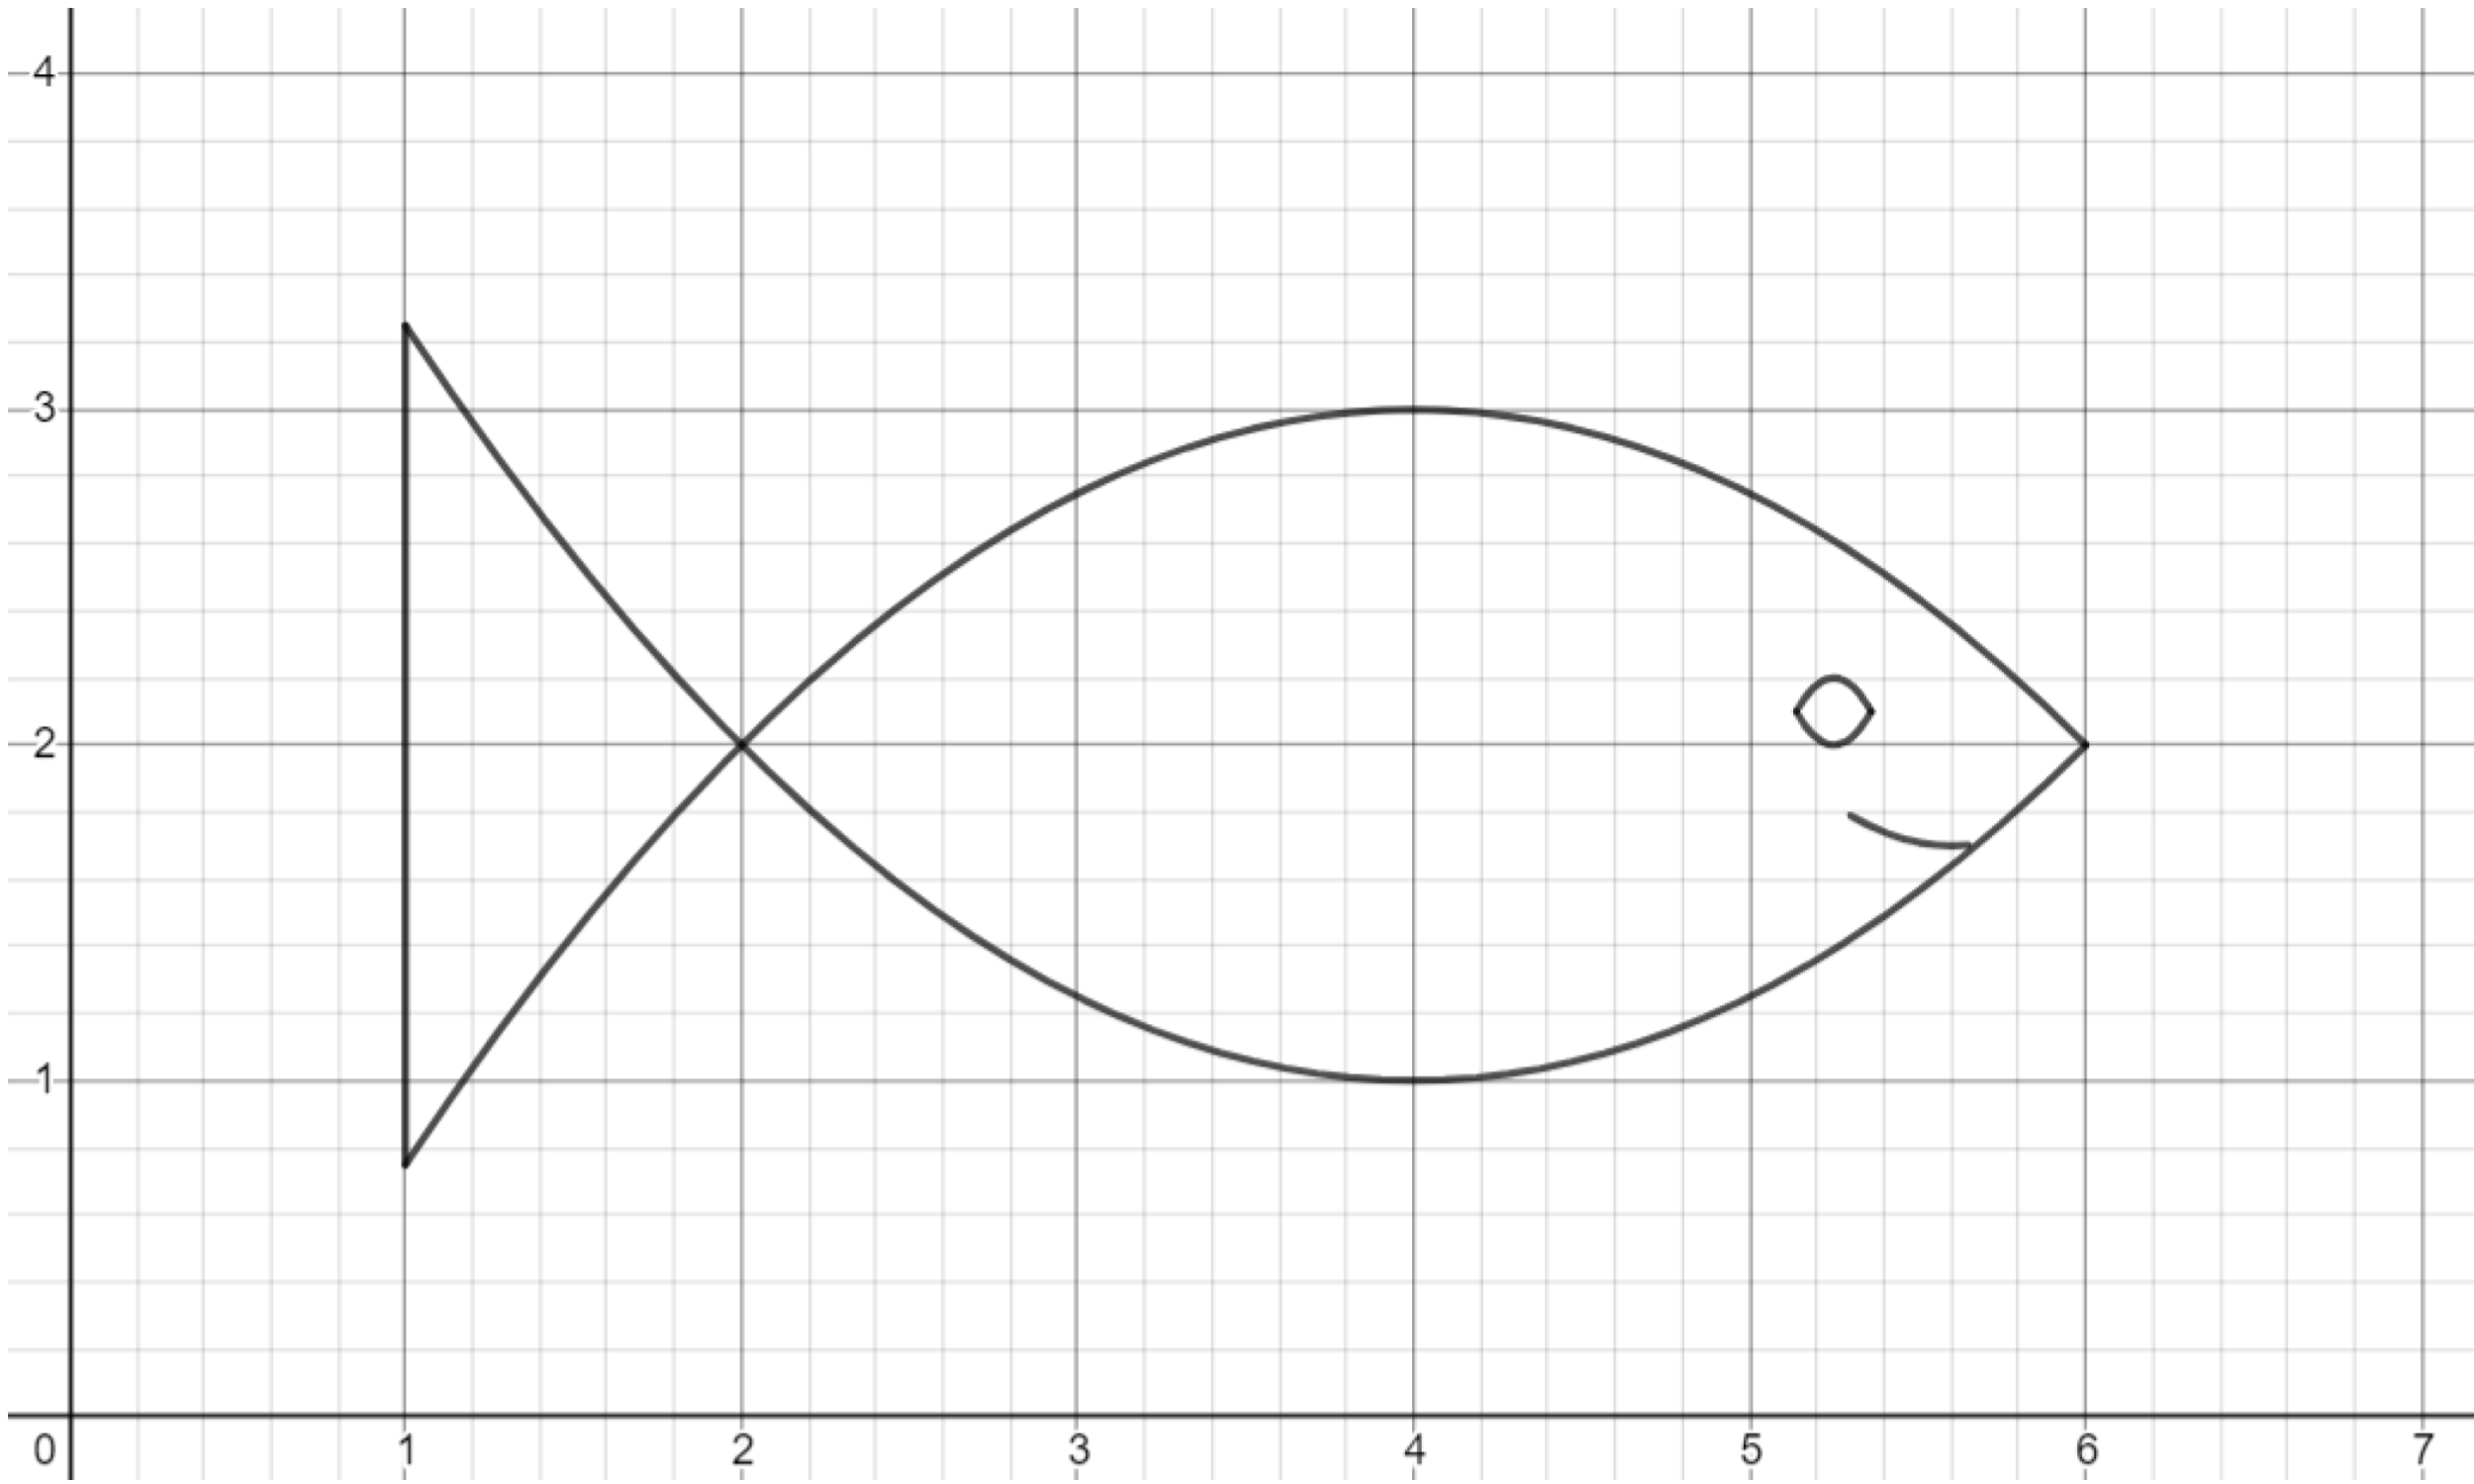
Exercise. Complete the final details of the fish.
Challenge. Draw a school of fish! You can try to include other sea creatures, as well.
This post is part of the book Graphing Calculator Drawing Exercises. Suggested citation: Skycak, J. (2019). Graphing Calculator Drawing: Parabolas. In Graphing Calculator Drawing Exercises. https://justinmath.com/graphing-calculator-drawing-parabolas/
Want to get notified about new posts? Join the mailing list and follow on X/Twitter.