Graphing Calculator Drawing: Lissajous Curves
Lissajous curves use sine functions to create interesting patterns in the plane.
This post is part of the book Graphing Calculator Drawing Exercises. Suggested citation: Skycak, J. (2019). Graphing Calculator Drawing: Lissajous Curves. In Graphing Calculator Drawing Exercises. https://justinmath.com/graphing-calculator-drawing-lissajous-curves/
Want to get notified about new posts? Join the mailing list and follow on X/Twitter.
Setup. Navigate to https://www.desmos.com/calculator. Be sure to sign in so that you can save your graph.
Demonstration - Lissajous Curves. Lissajous curves take the form
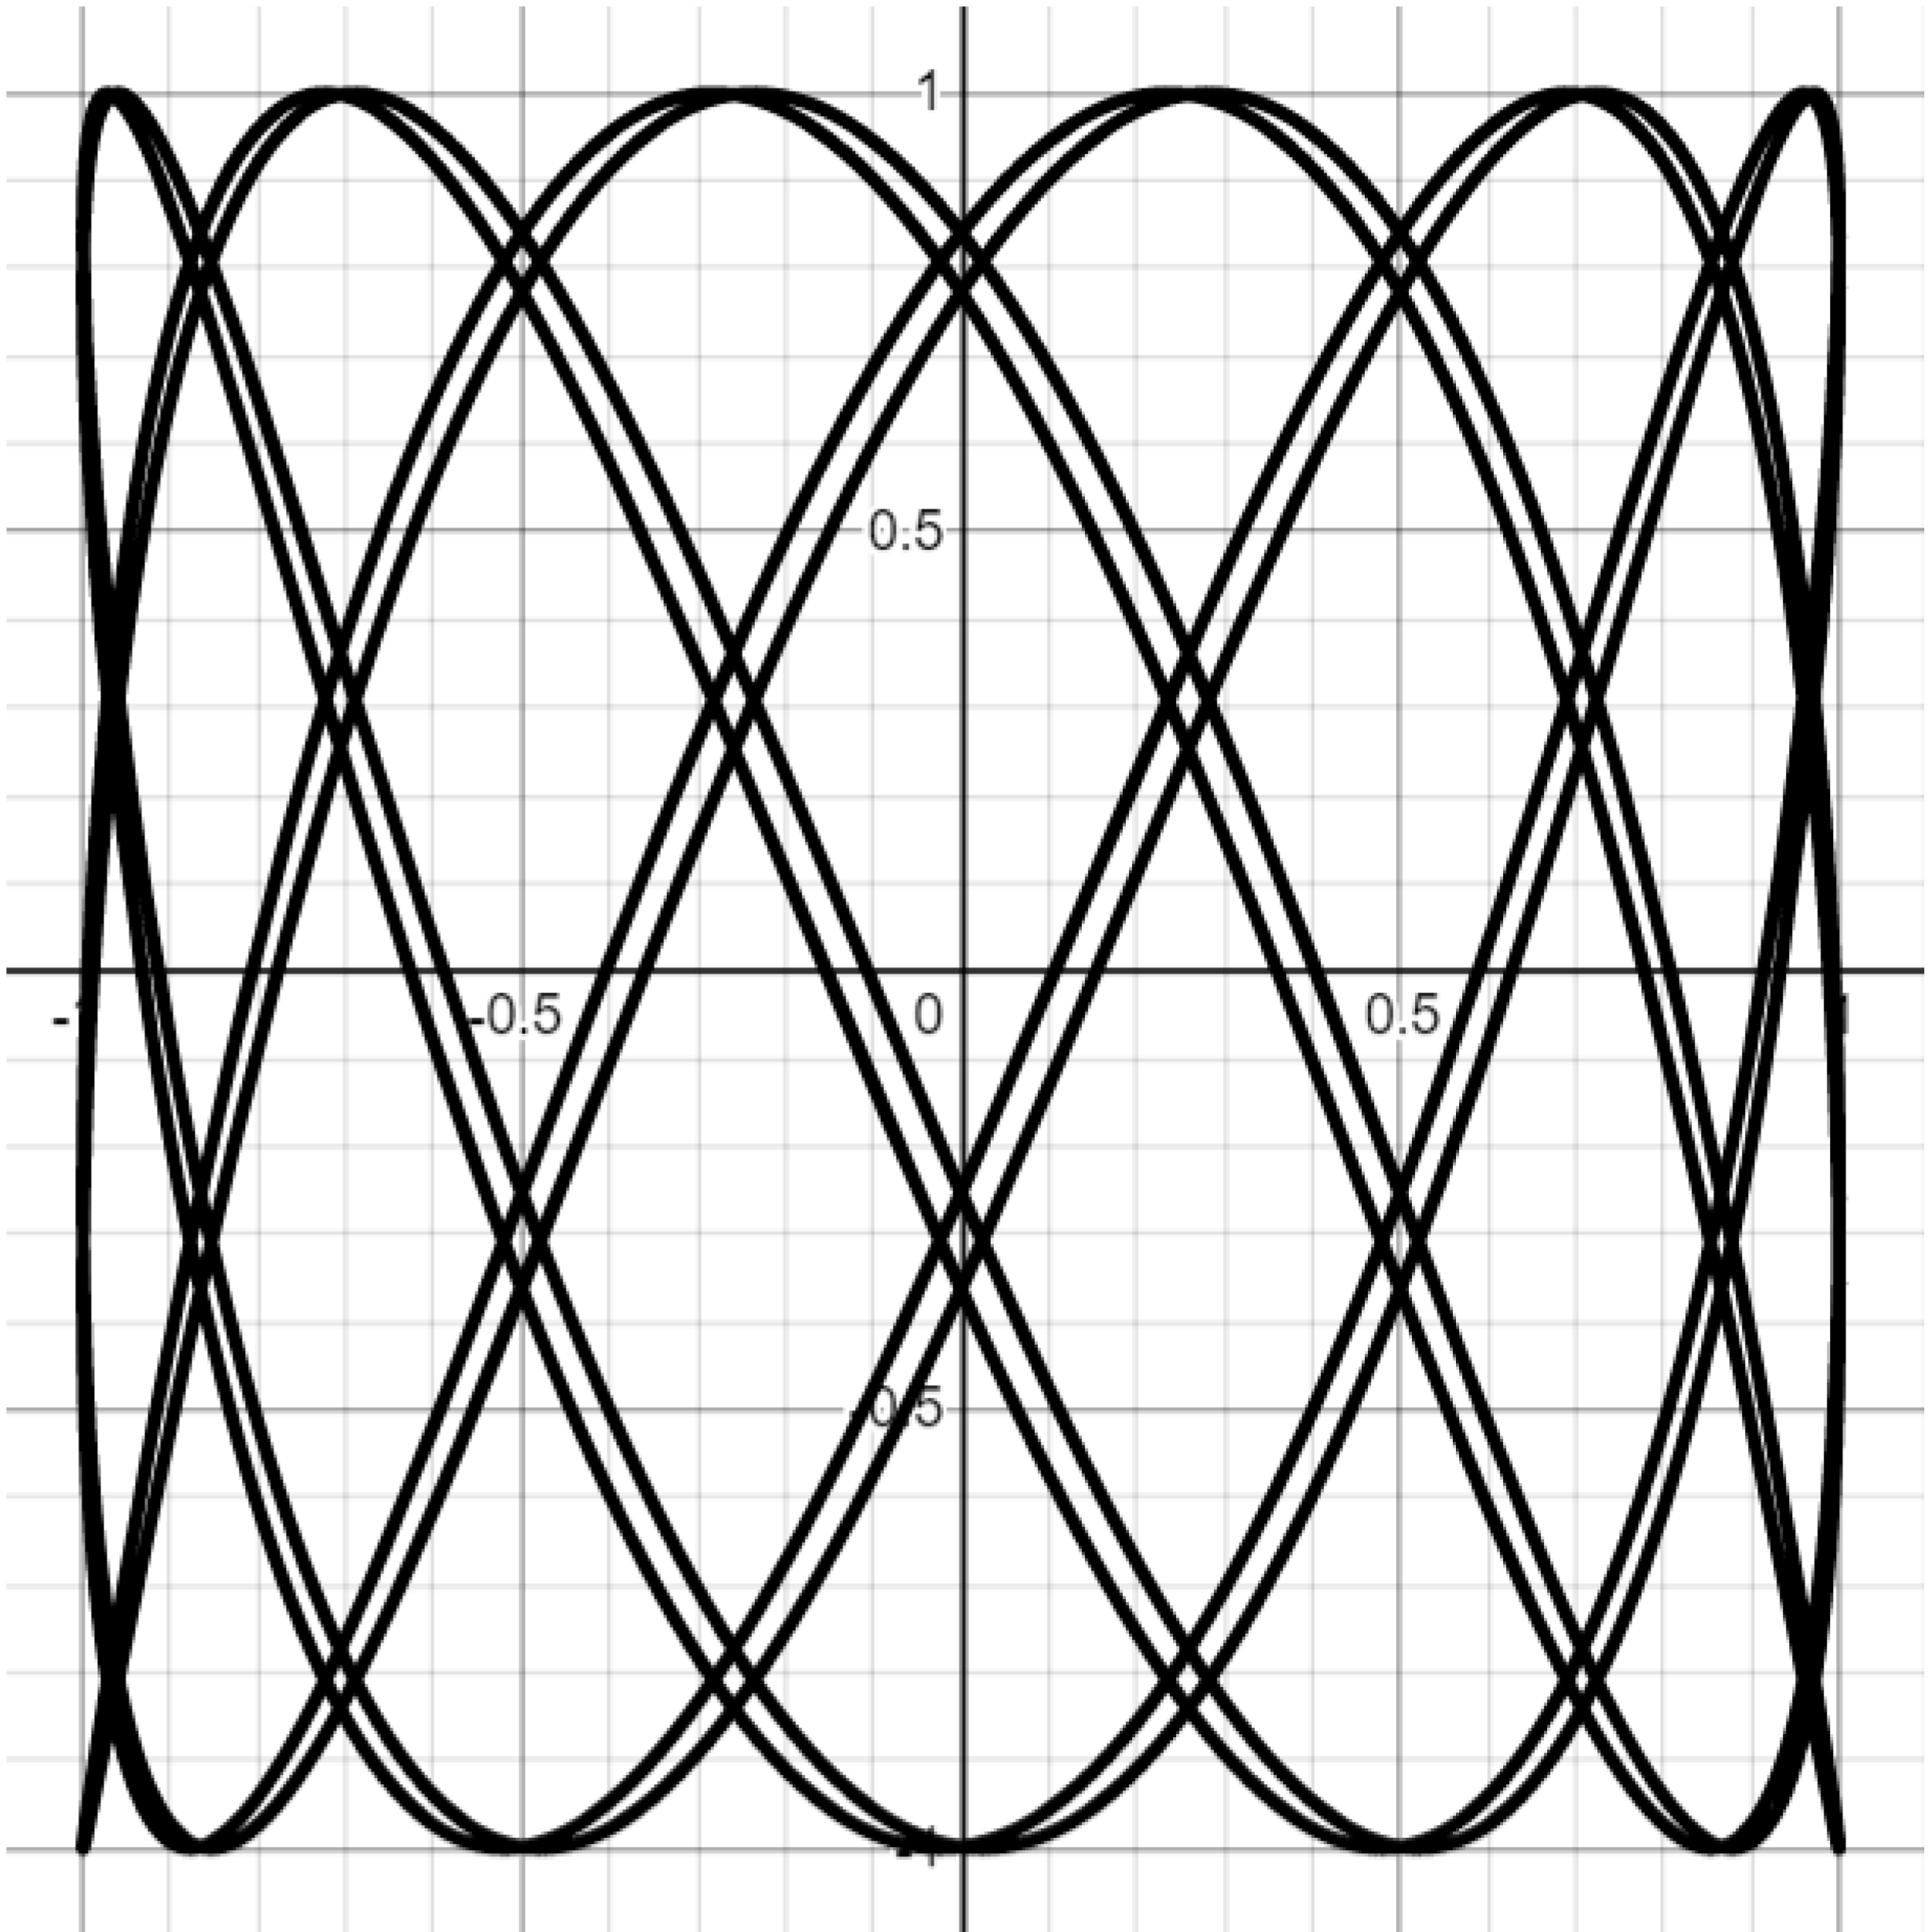
for some values of $a$ and $b.$ Observe the graph as you type each of the following Lissajous plot inputs, with $0 \leq t \leq 100.$
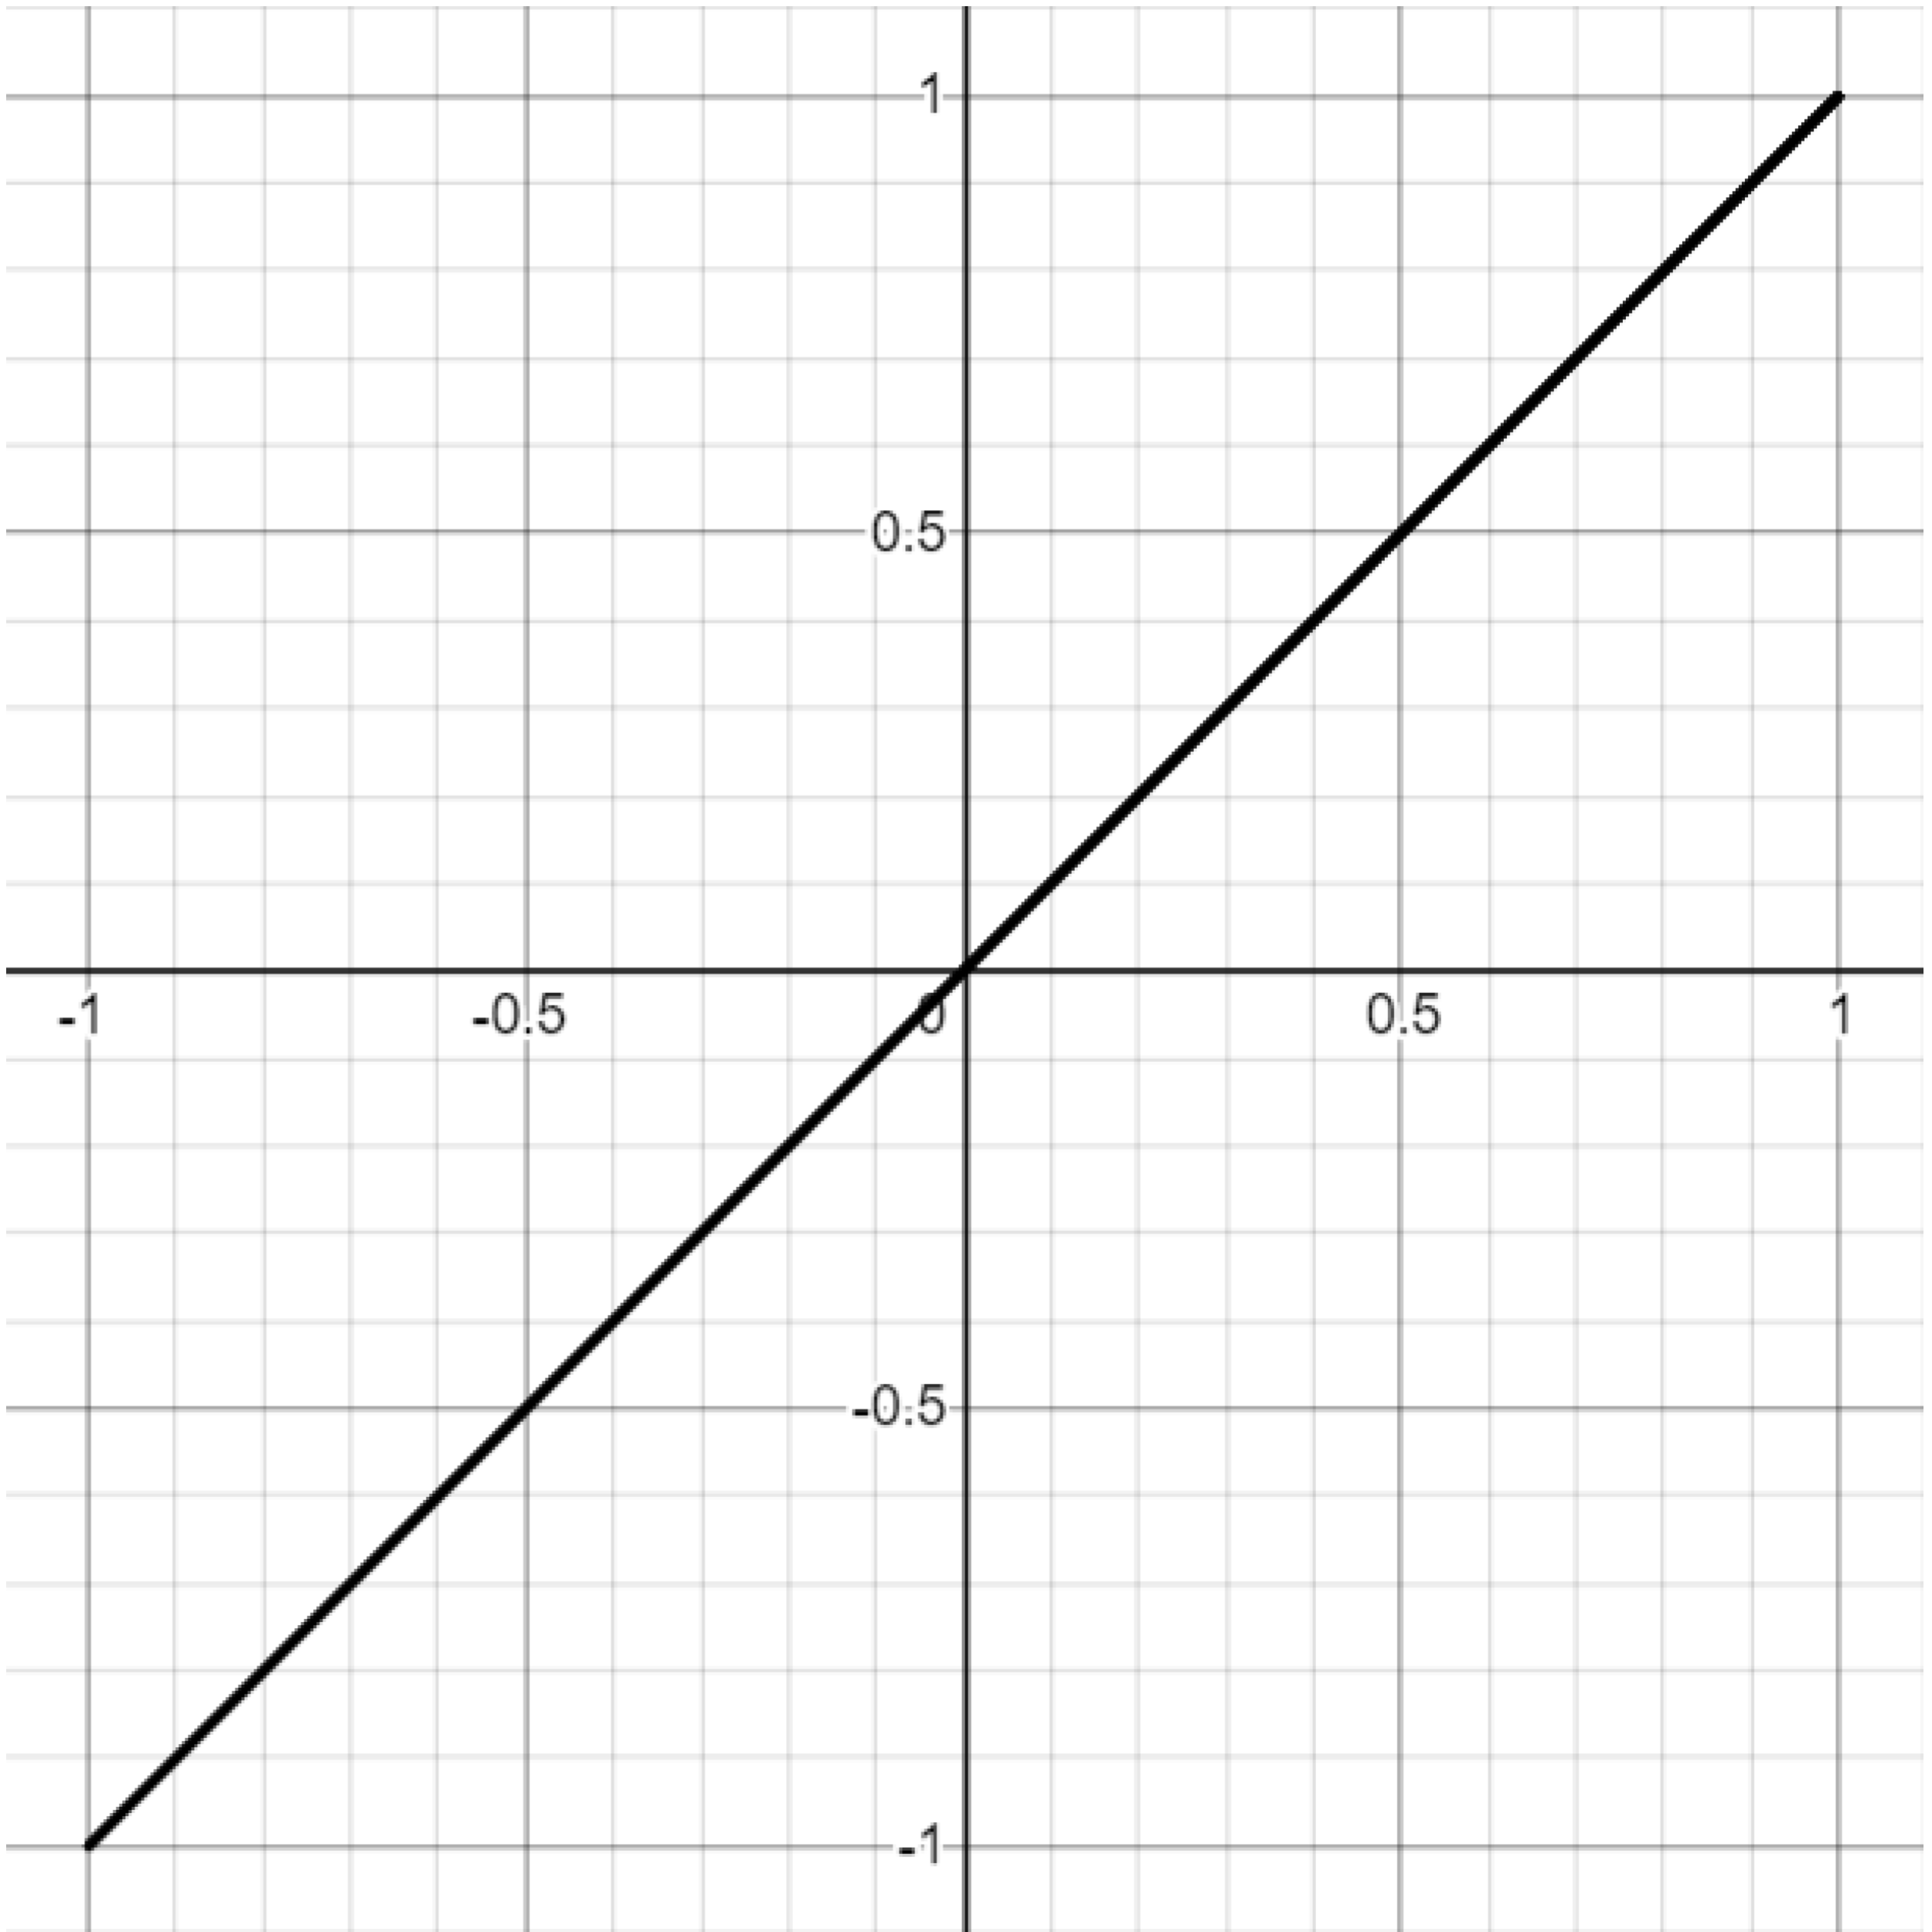
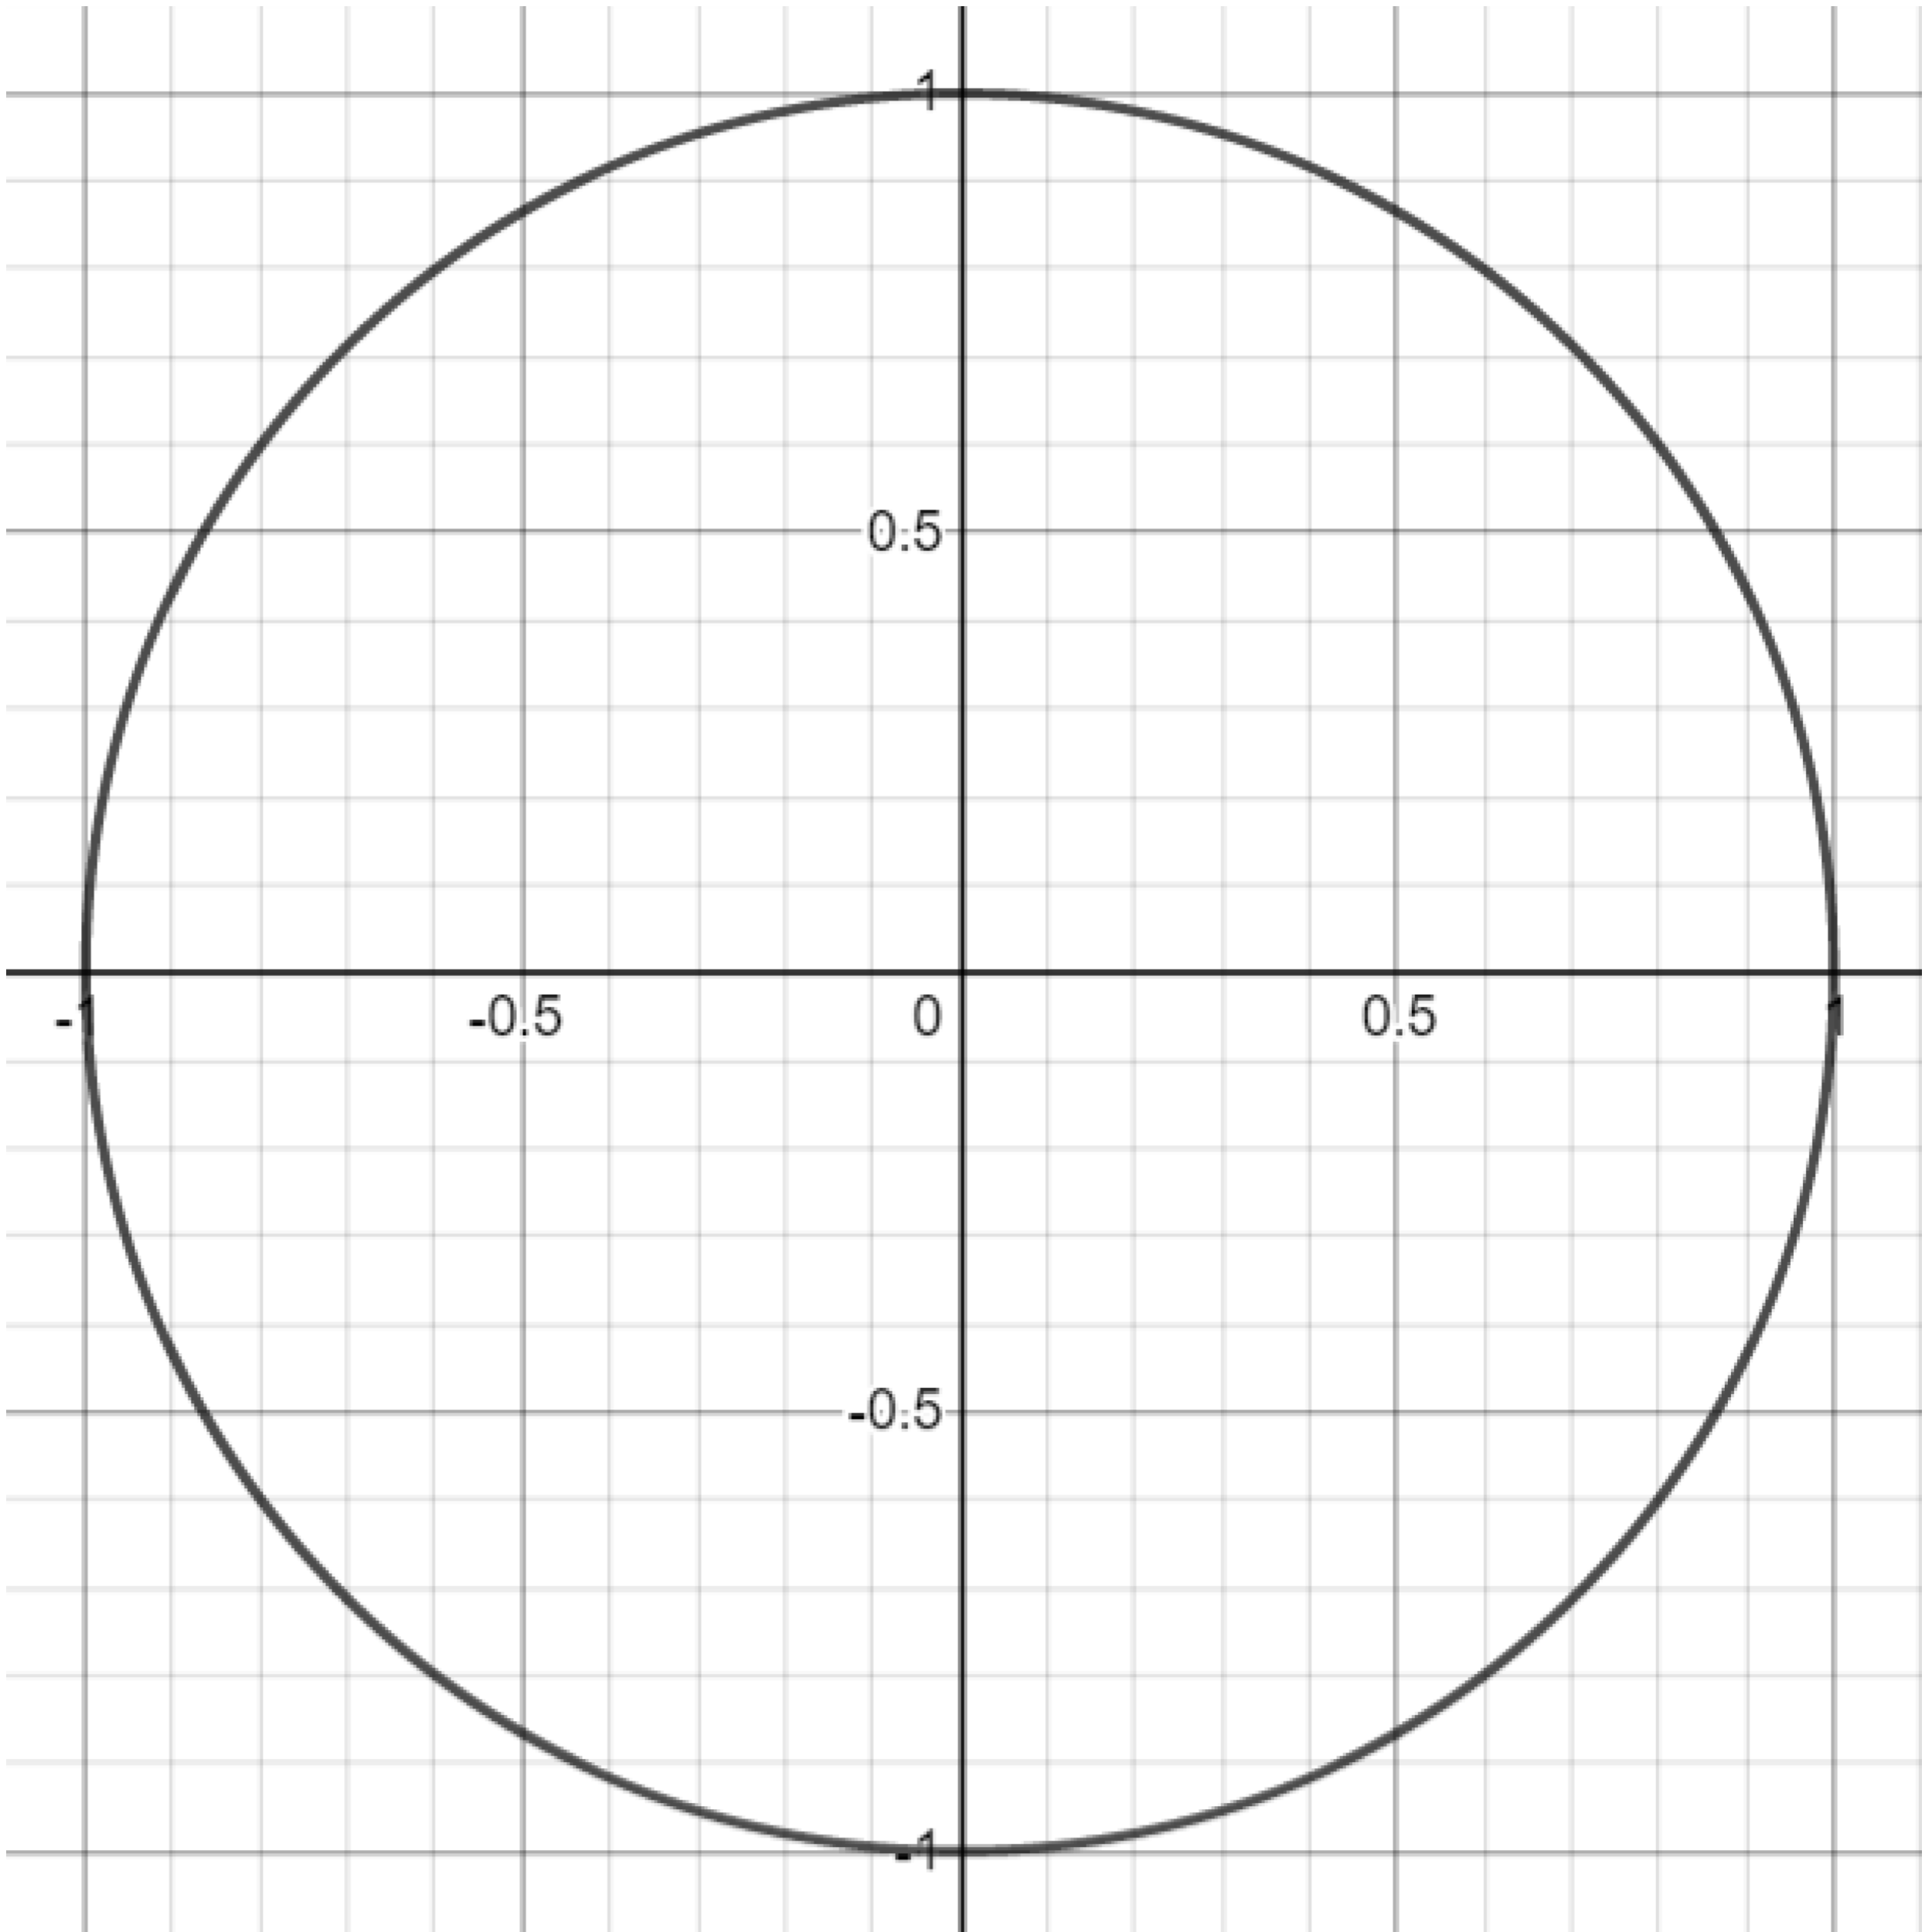
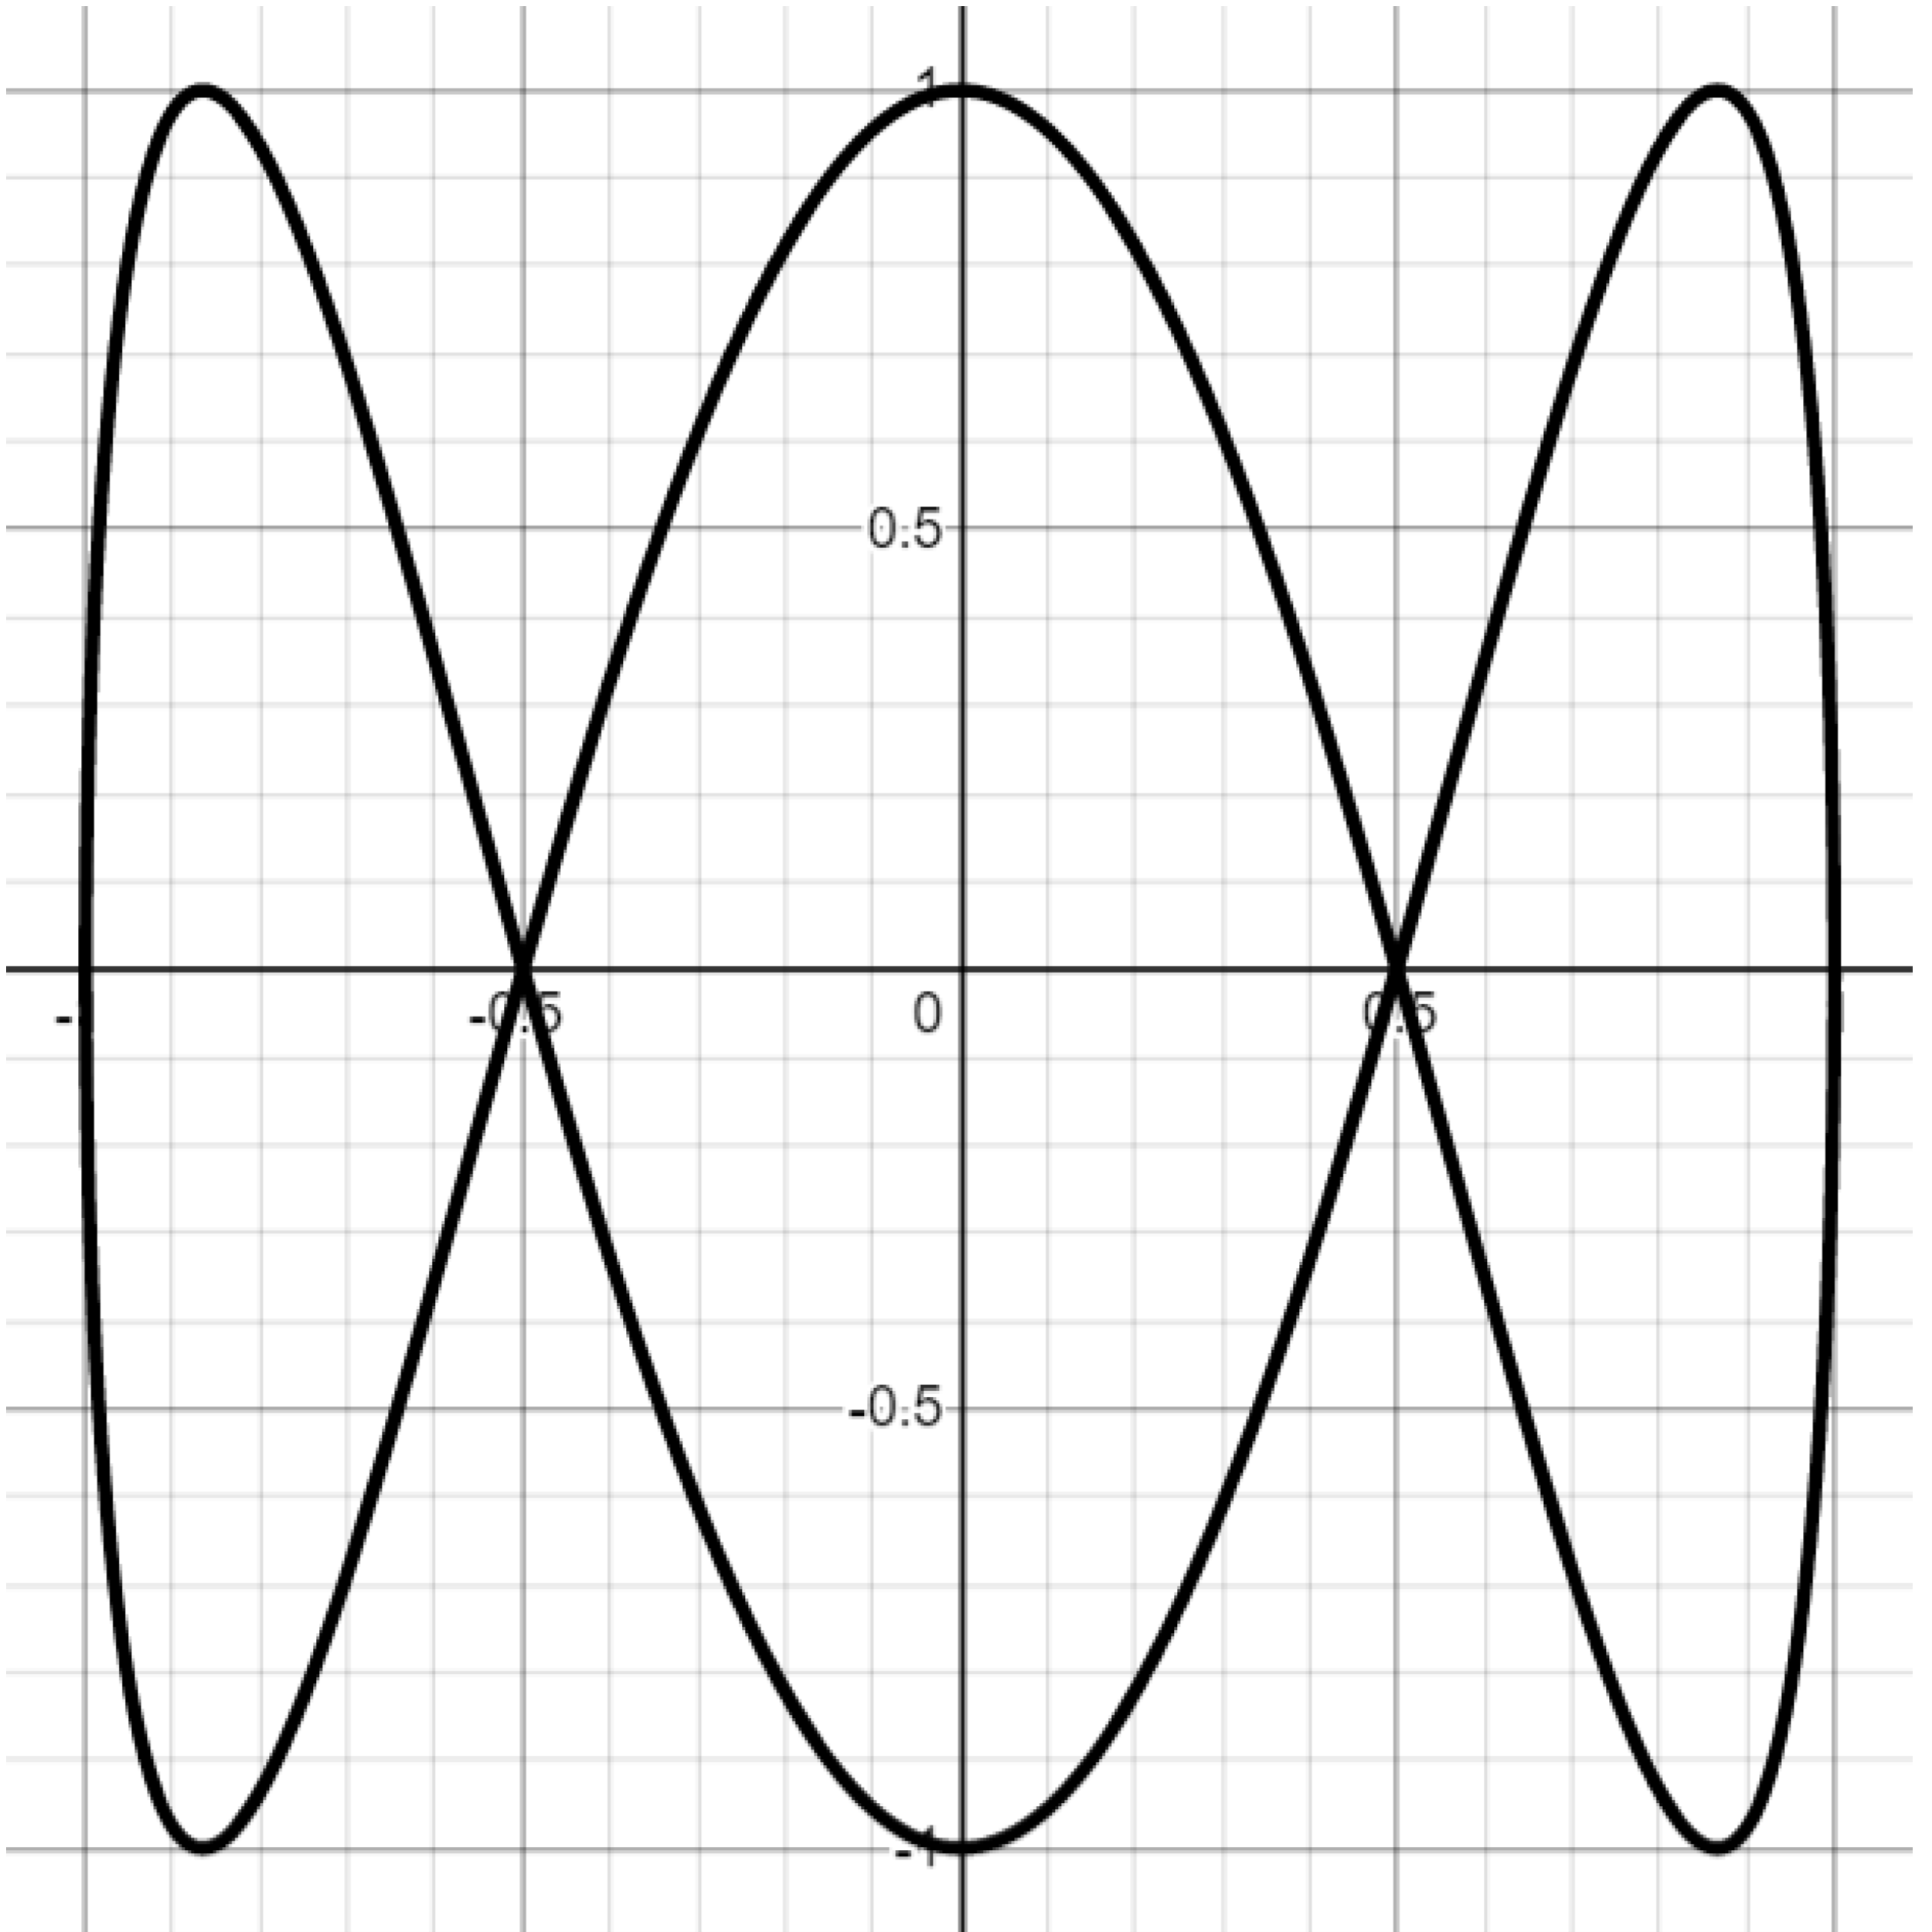
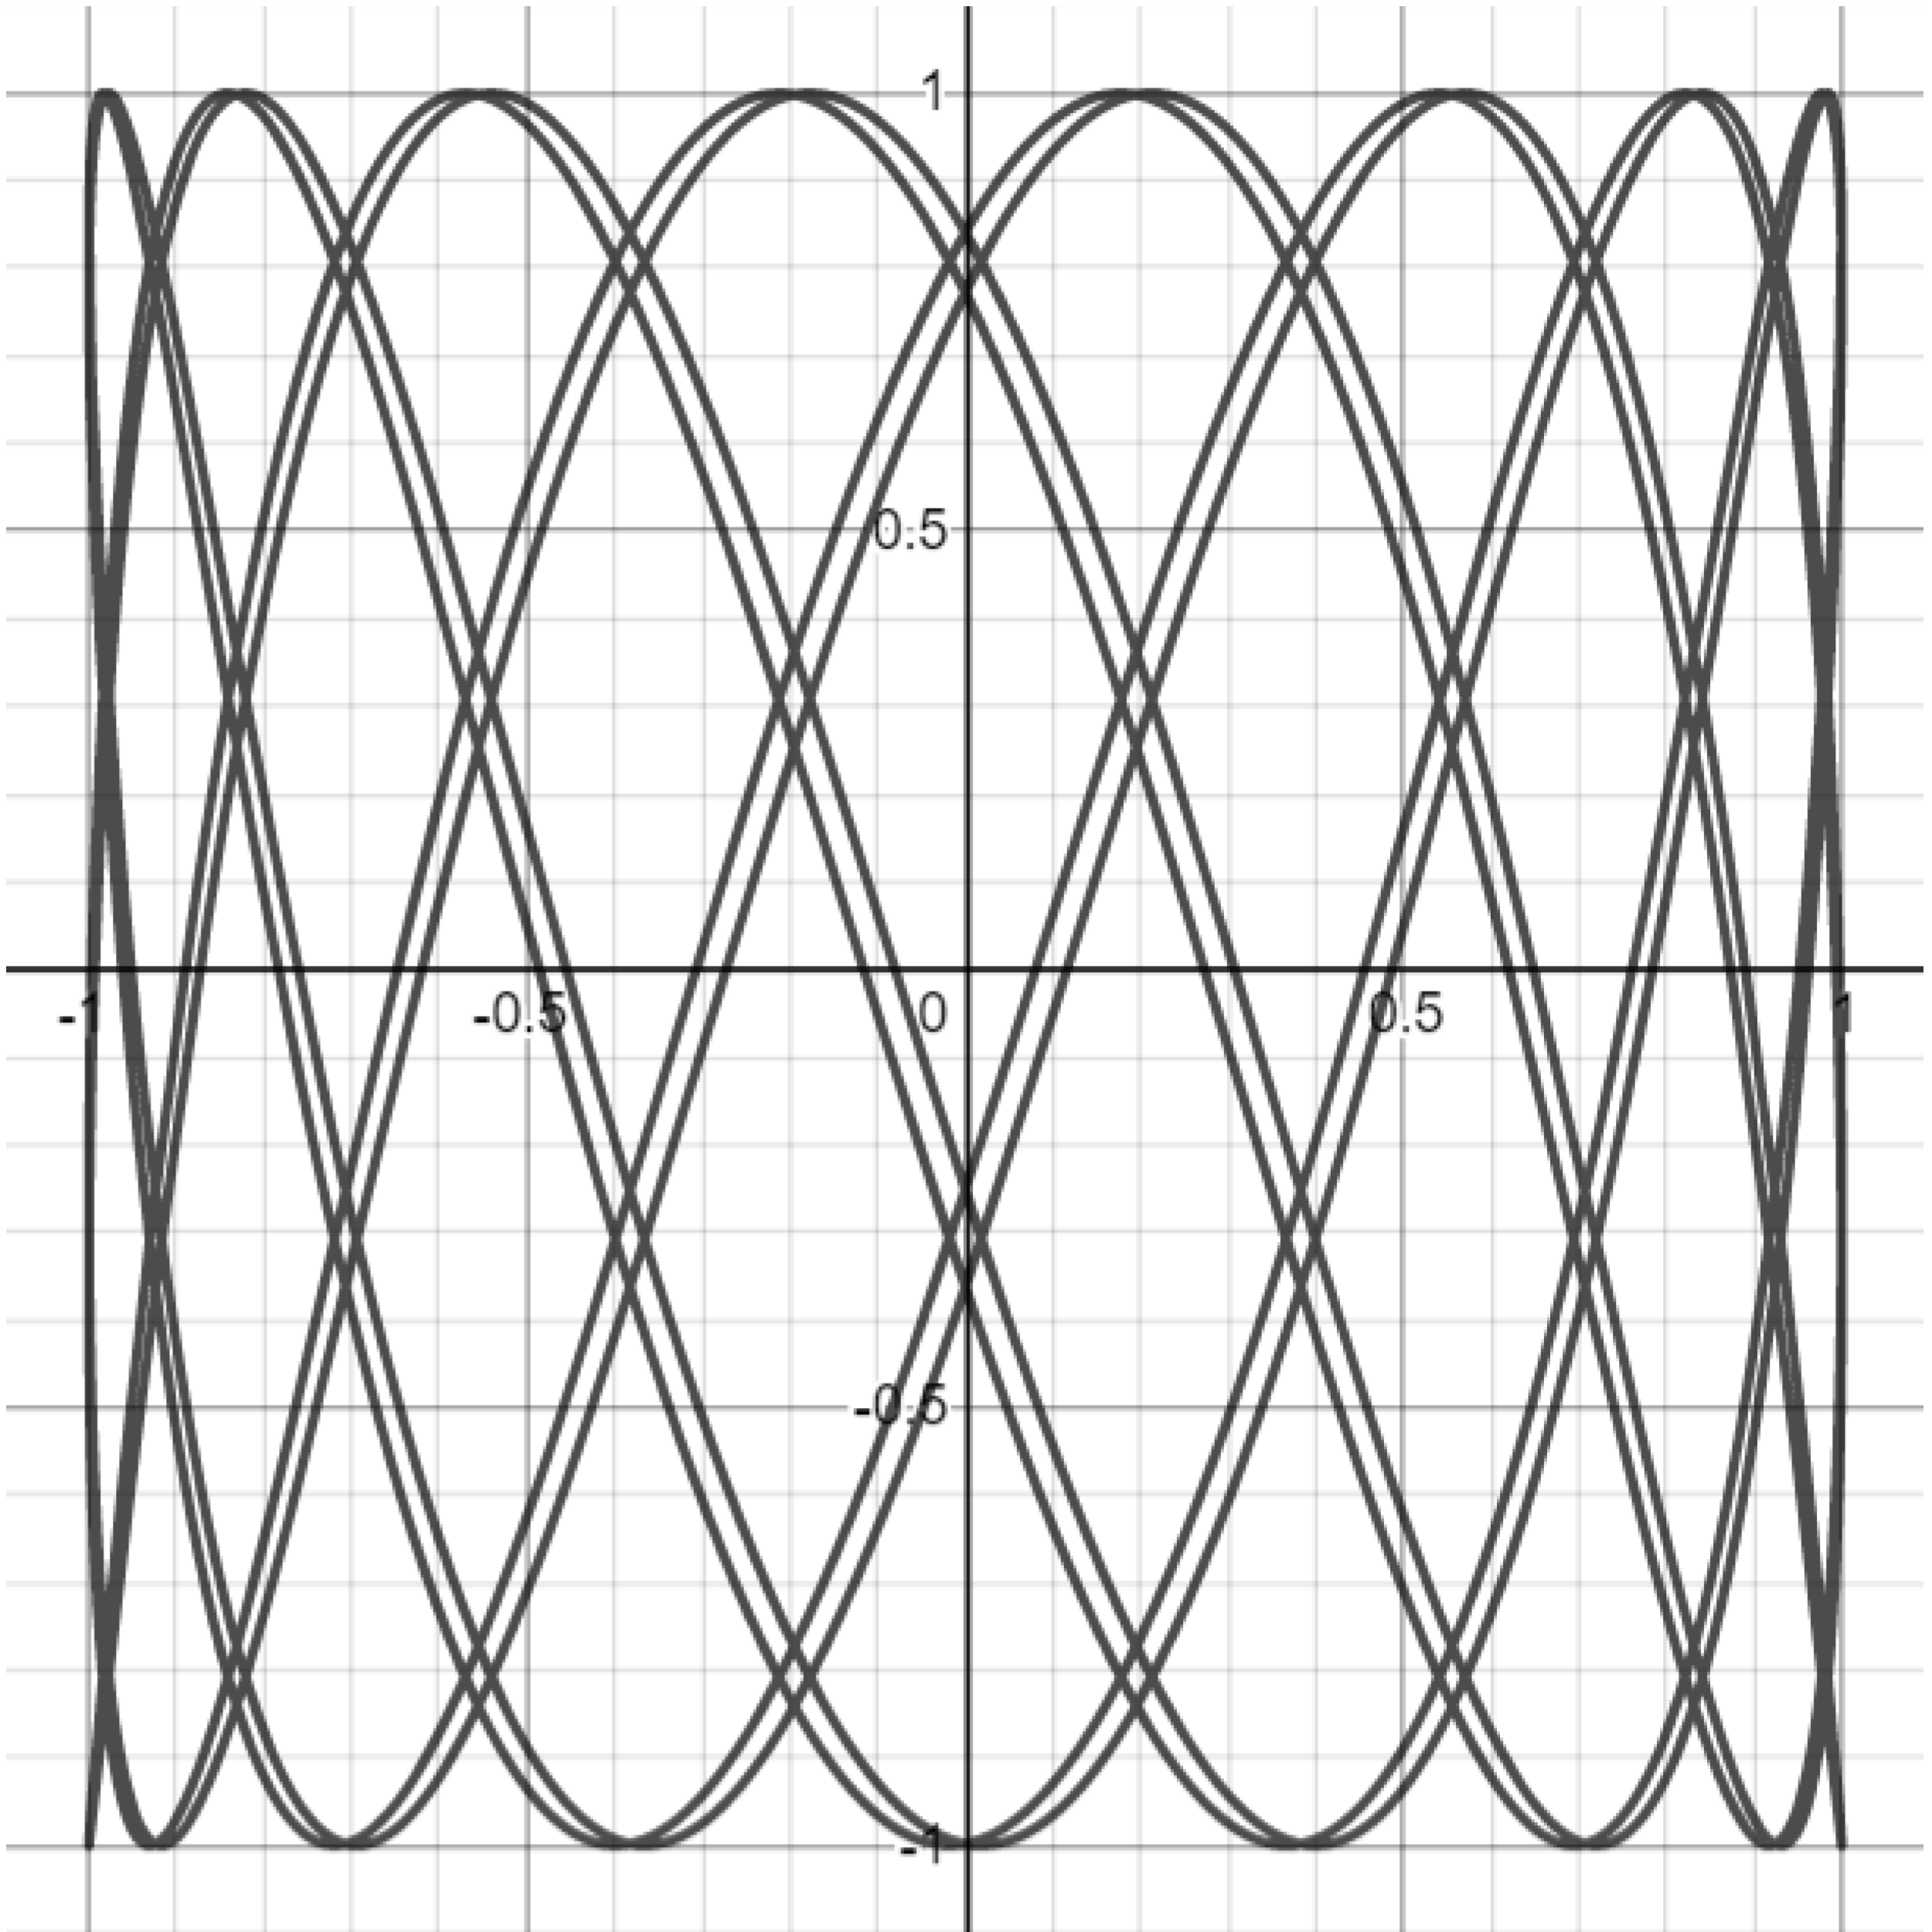
Exercise. Attempt to reproduce the graphs below by setting $a=1$ and varying the $b$ parameter in the Lissajous curve equations. You may have to play with the parameter a bit to get a sense of what it controls.
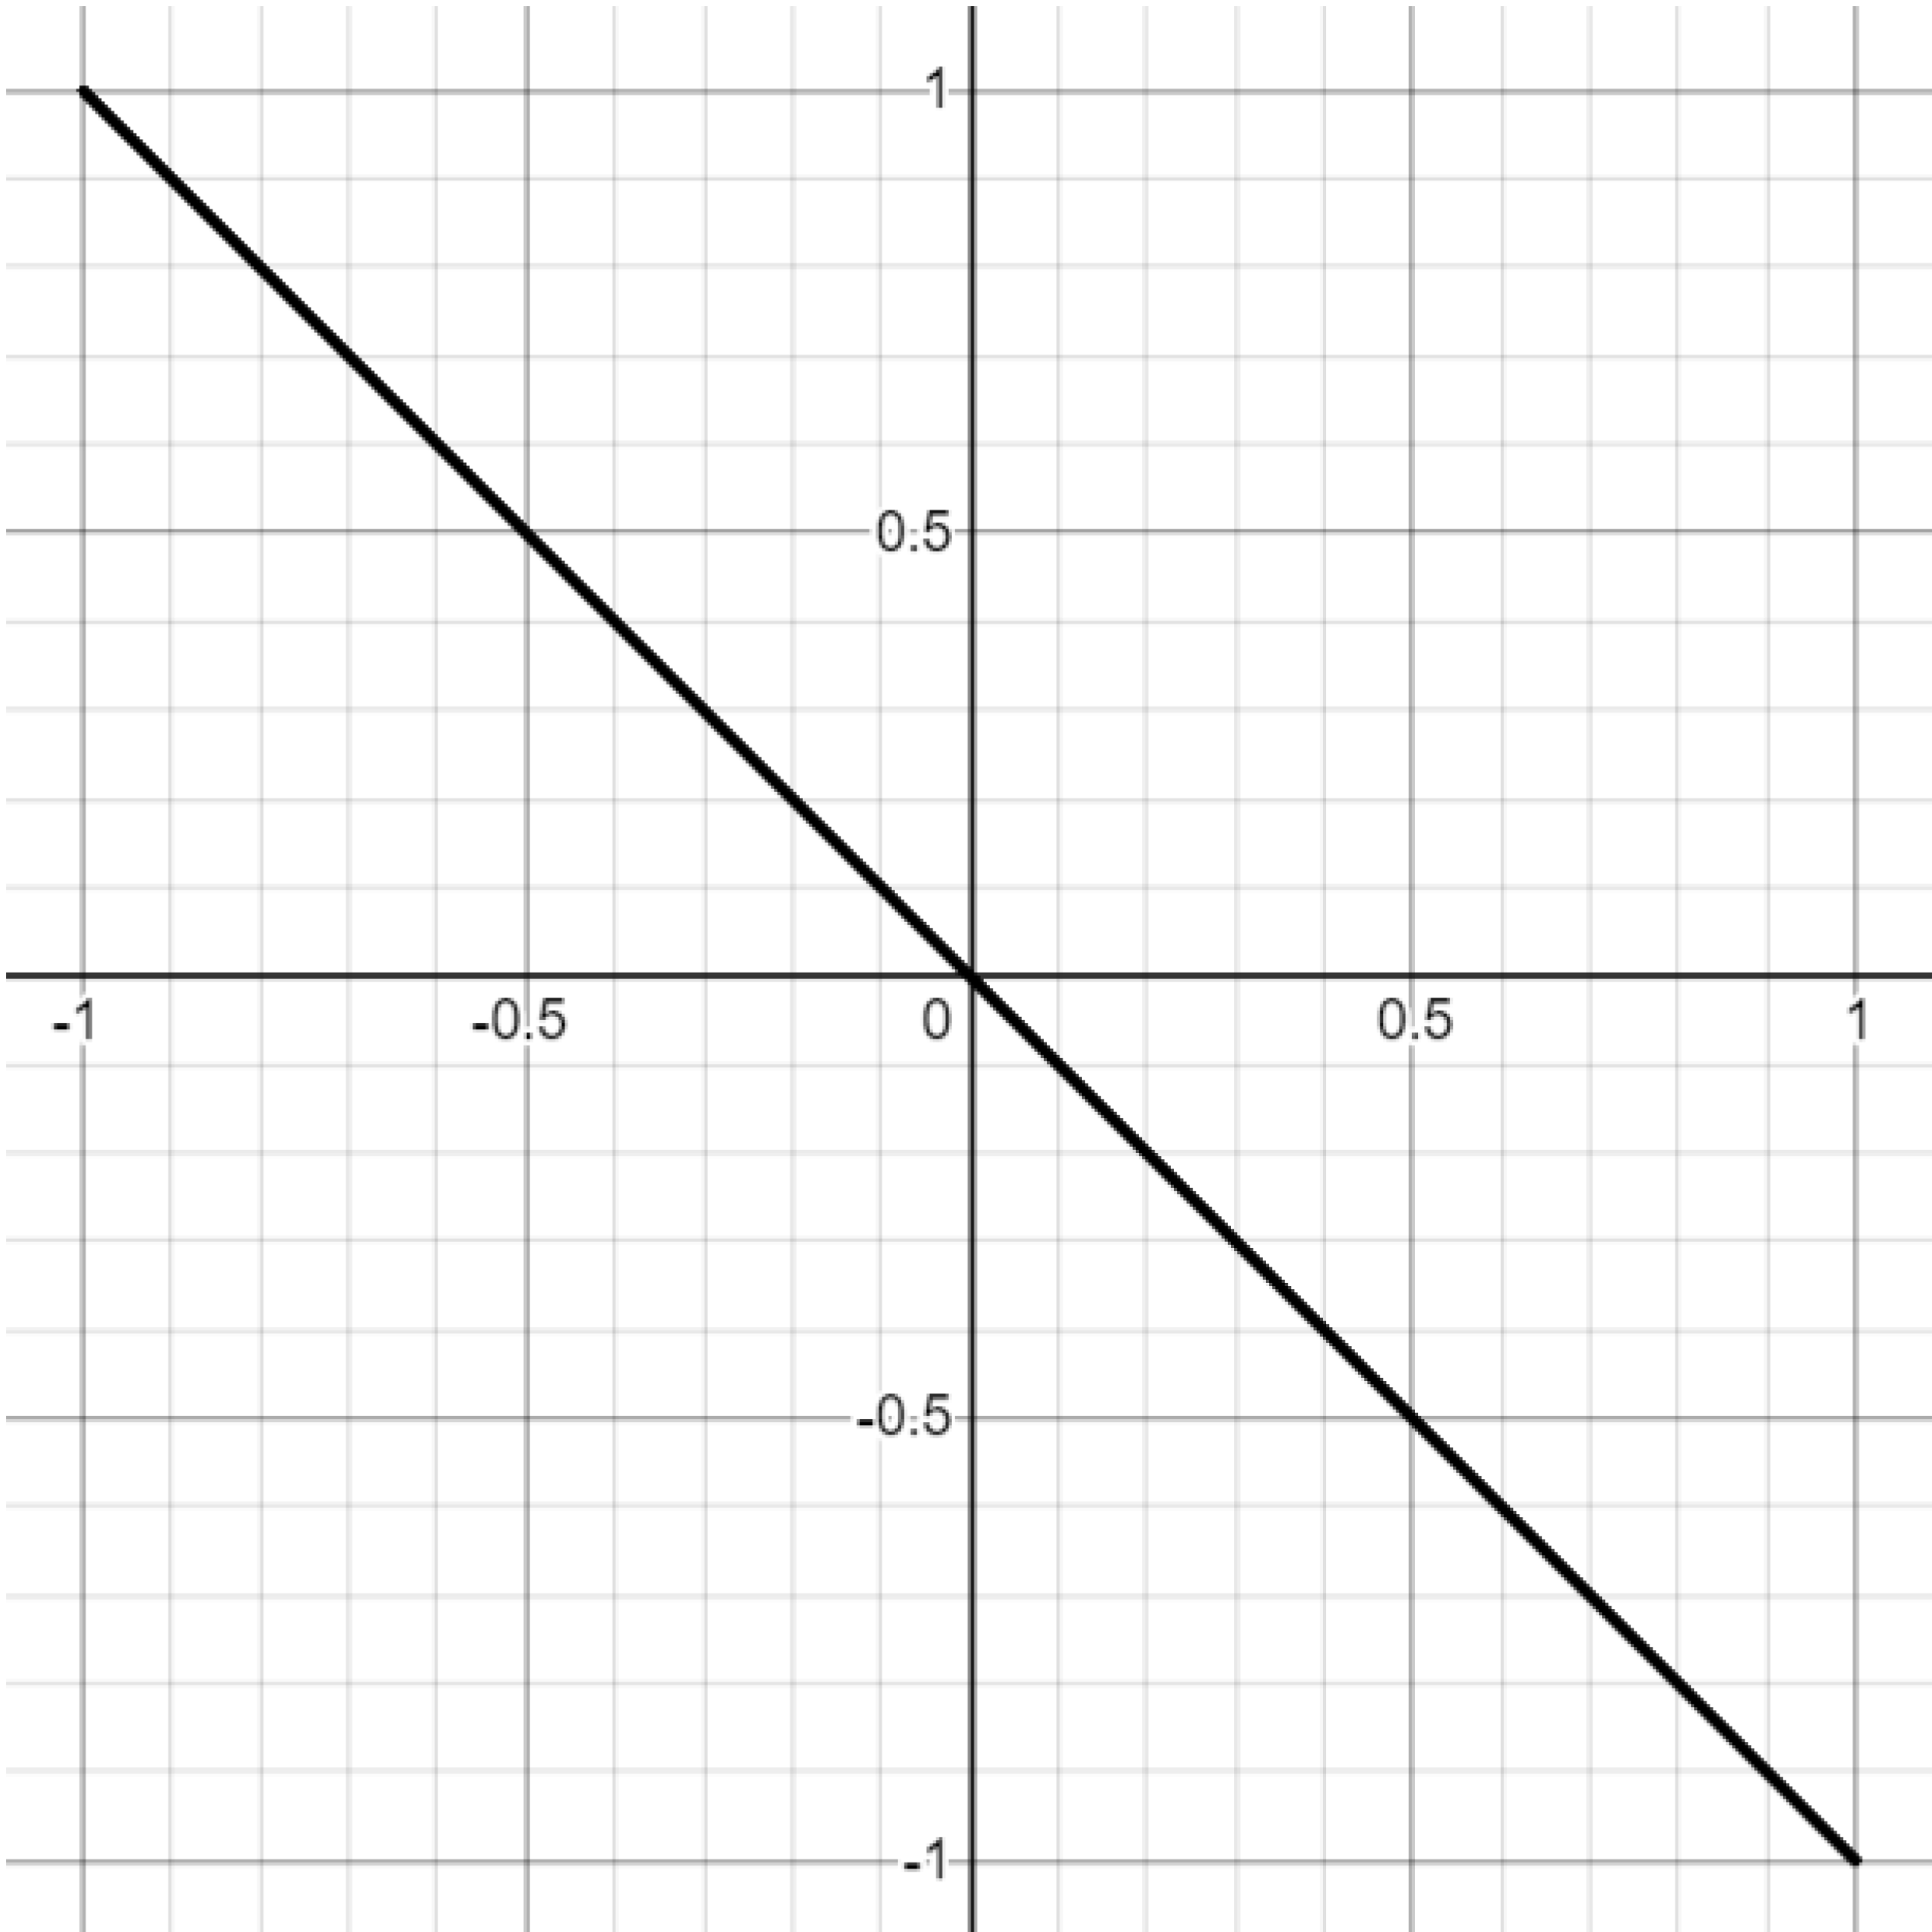
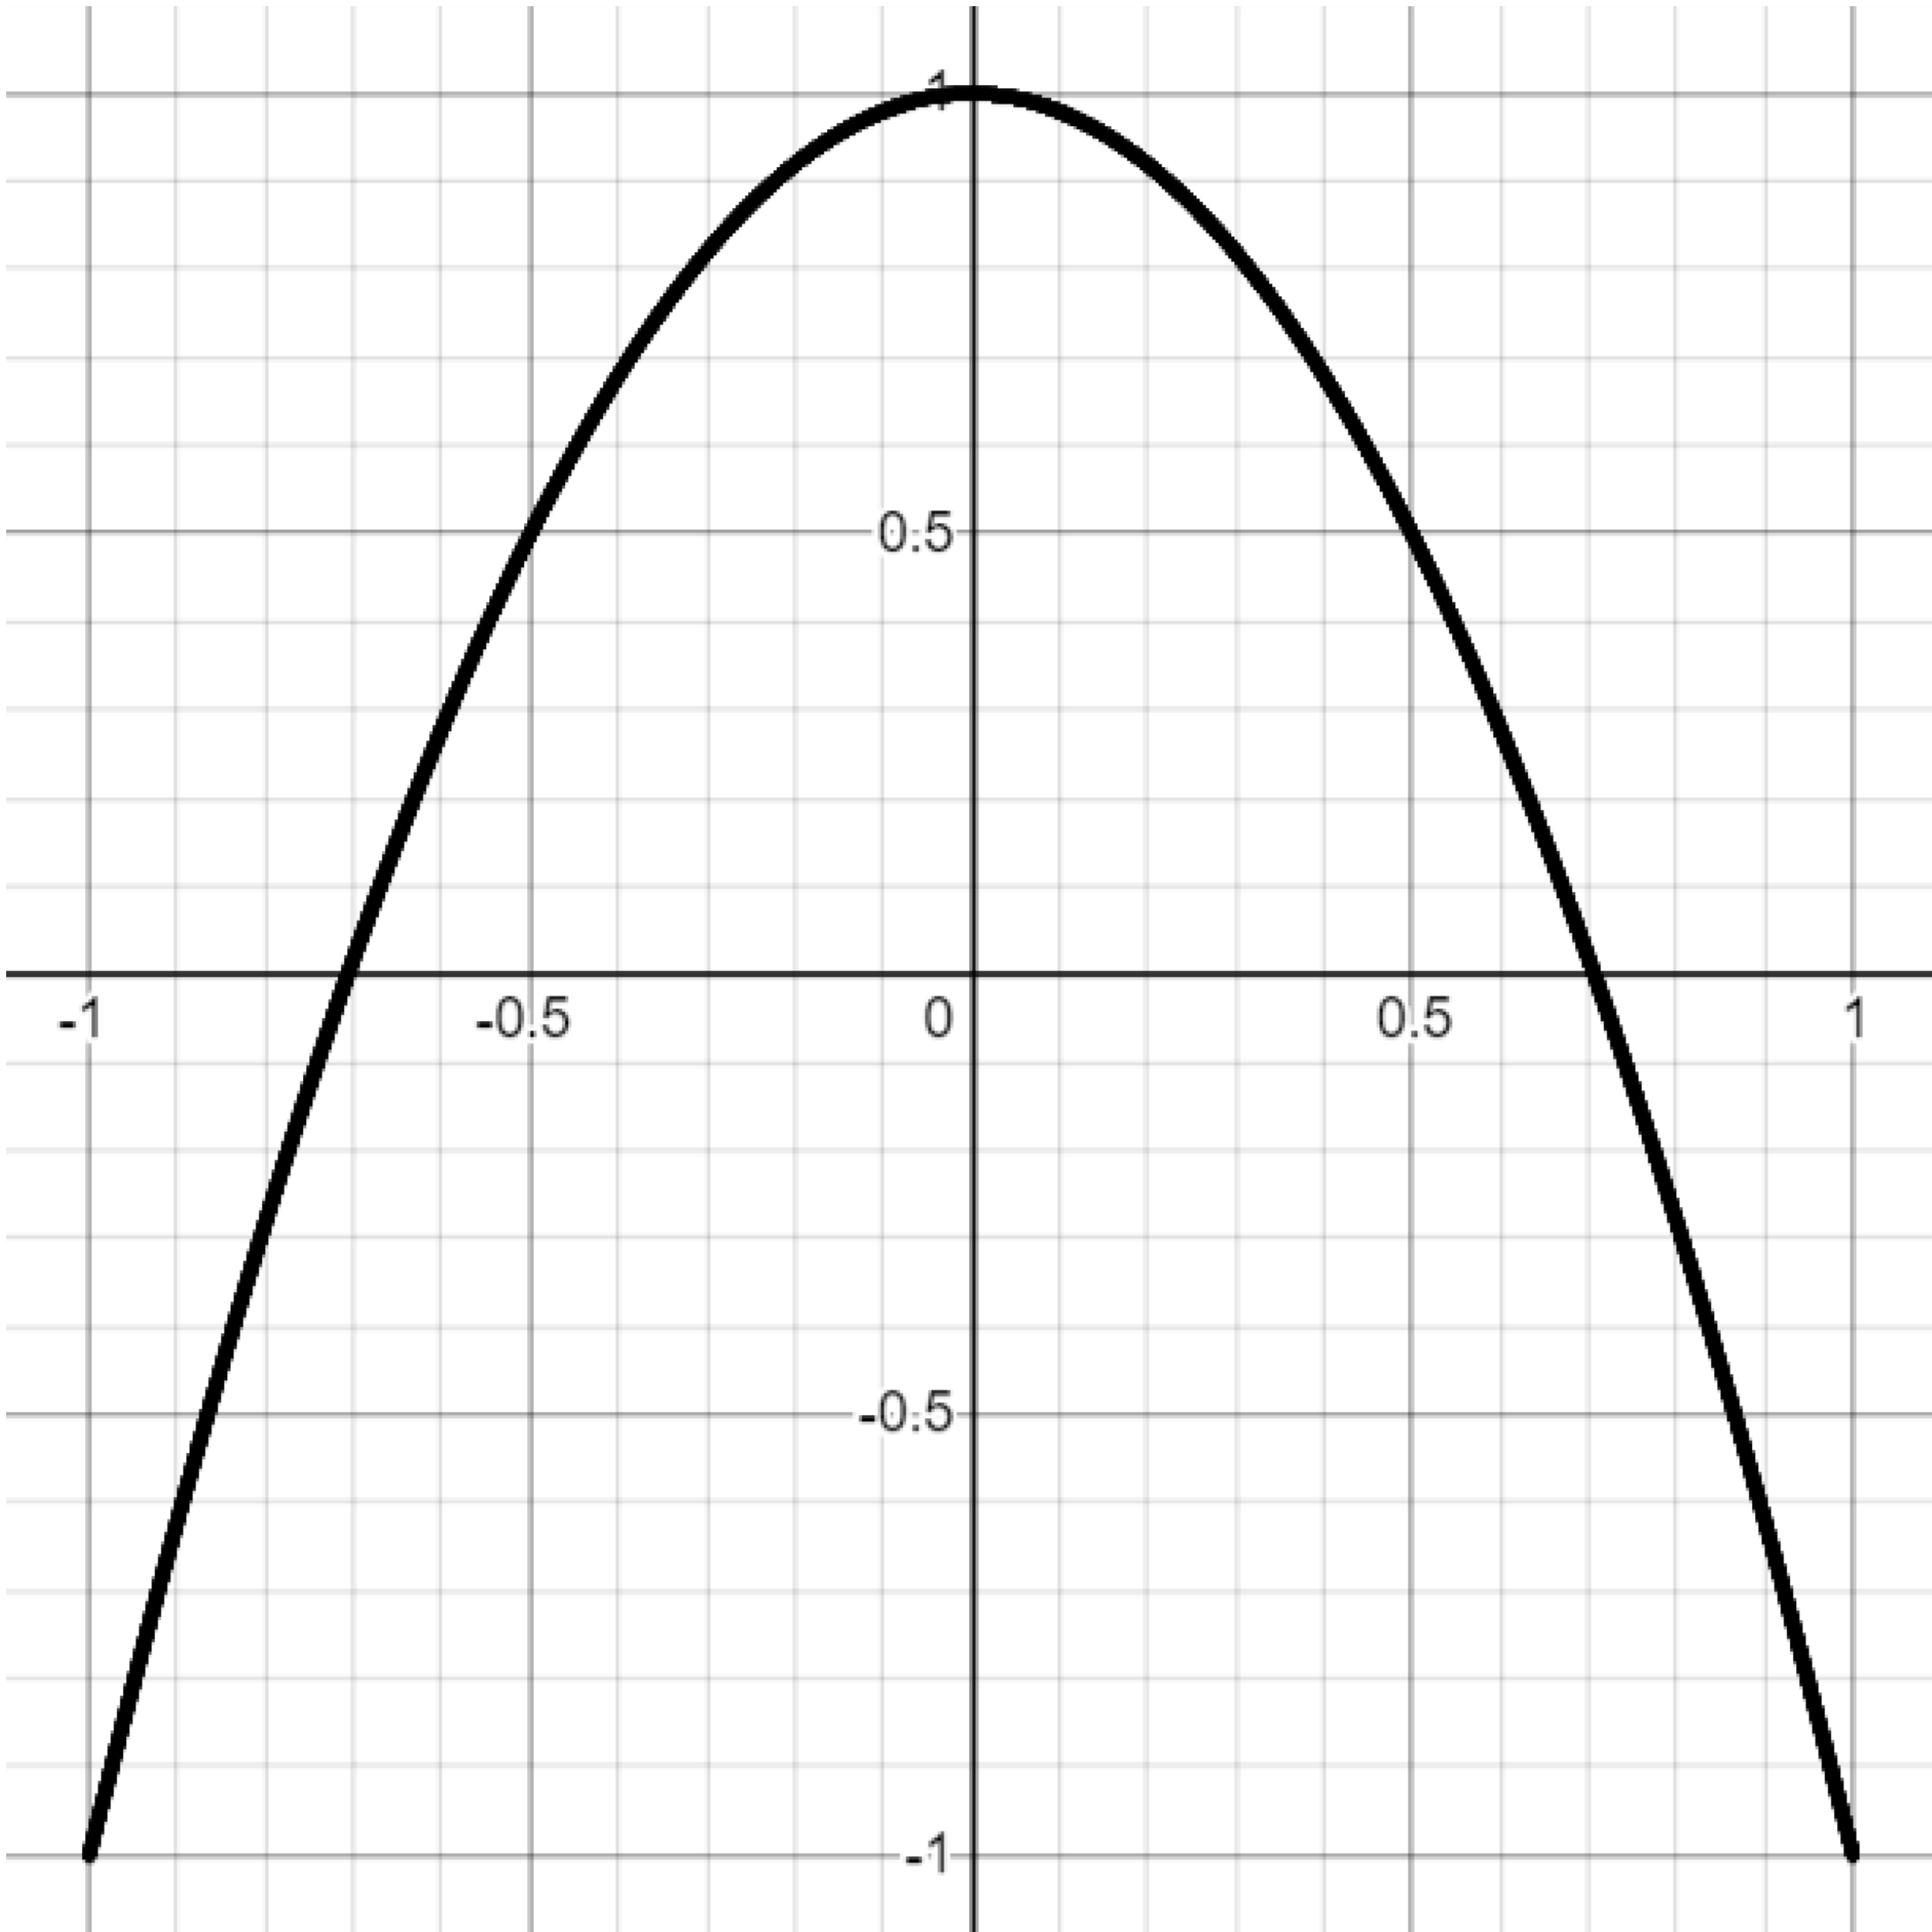
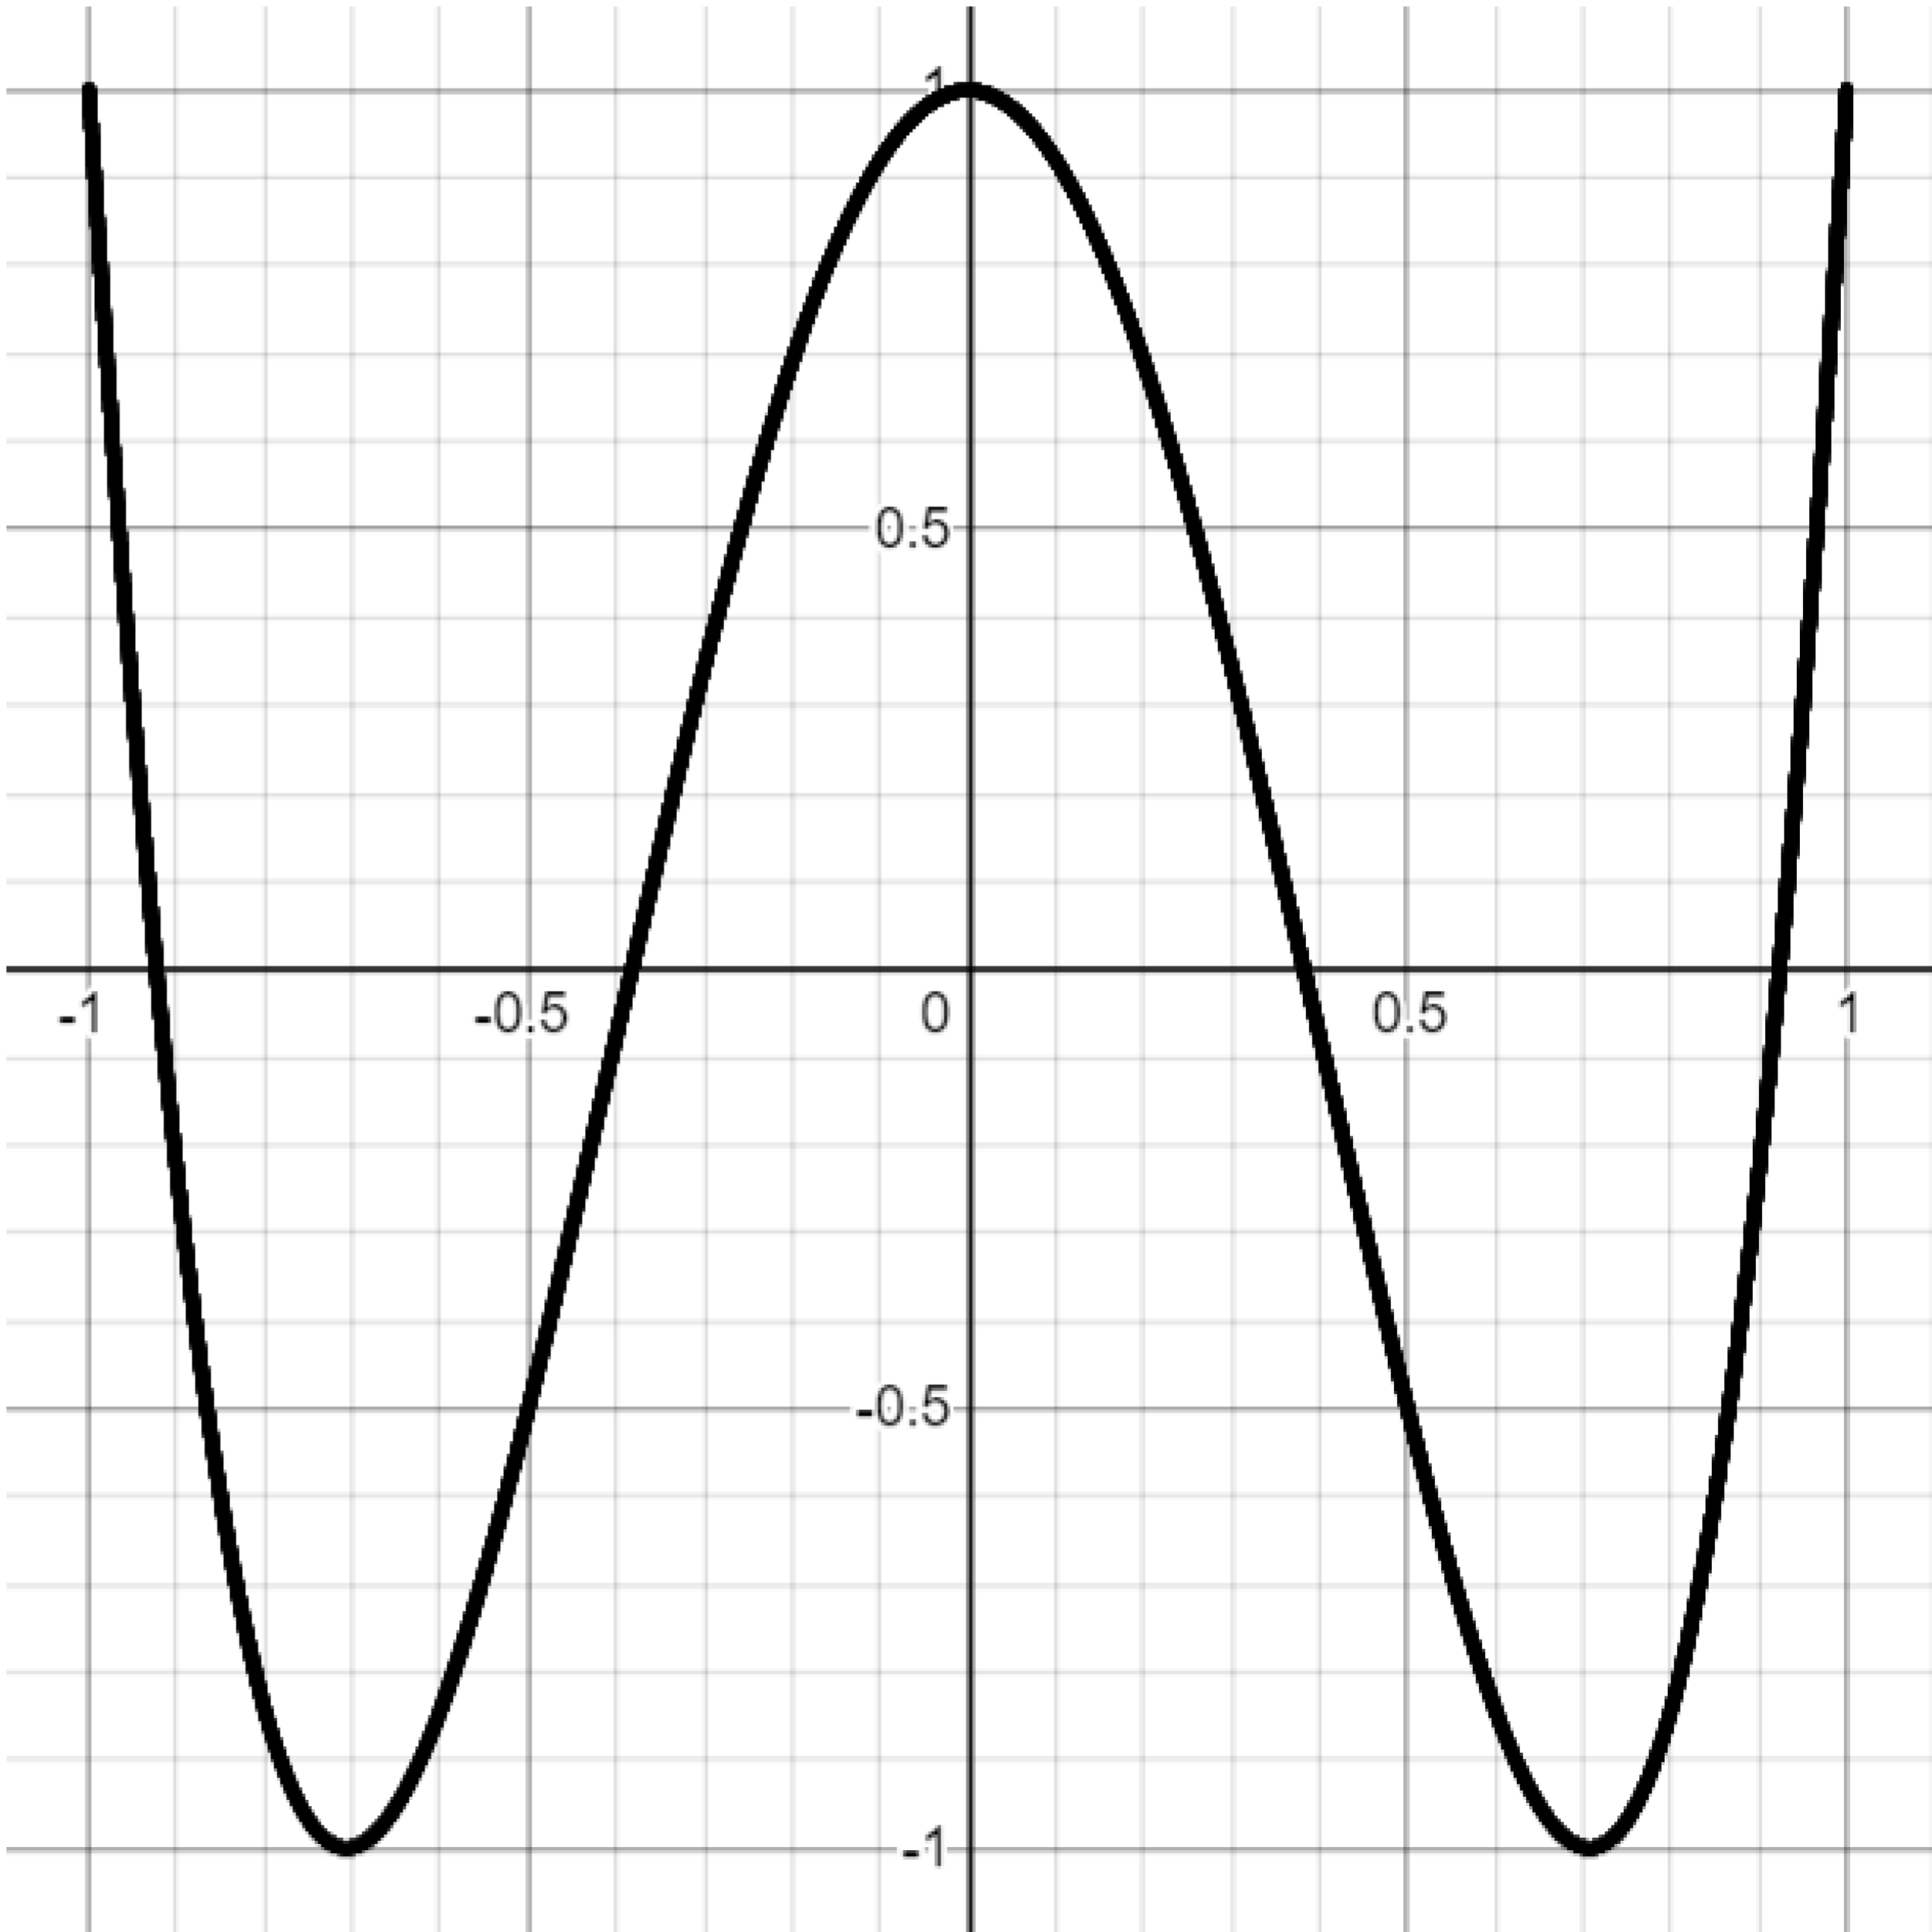
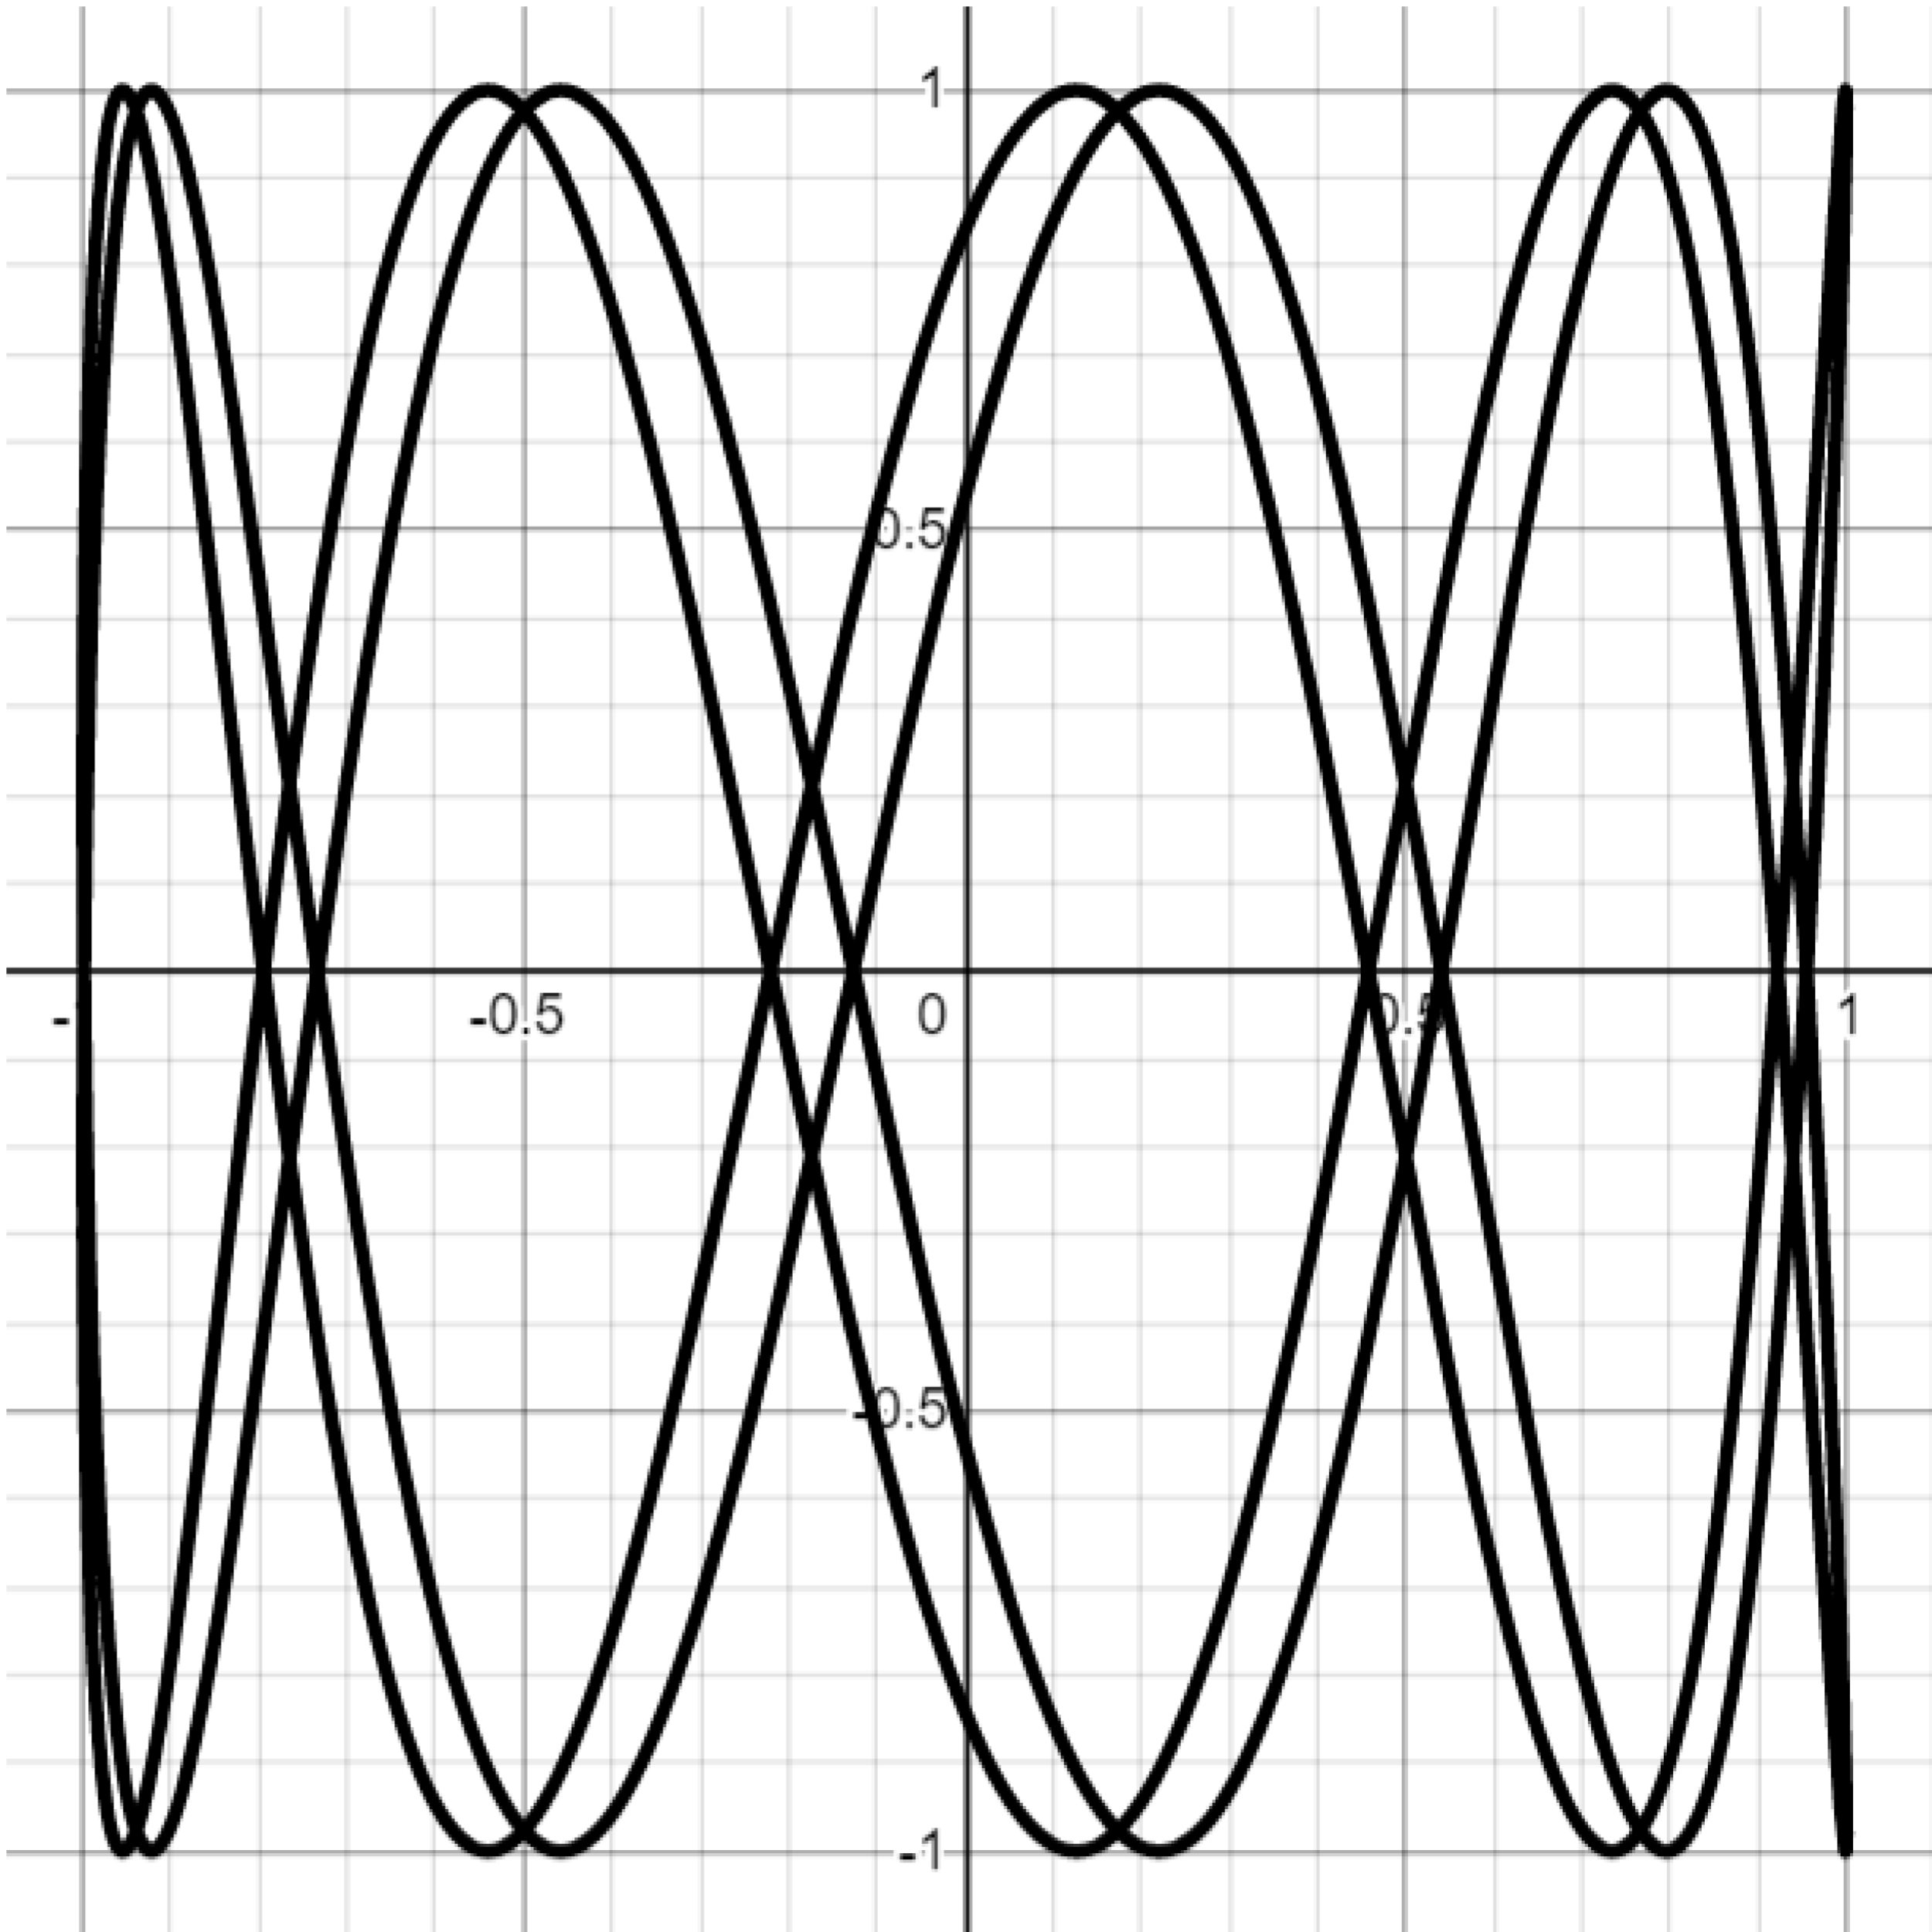
Exercise. Attempt to reproduce the graphs below by setting $b=\frac{\pi}{2}$ and varying the $a$ parameter in the Lissajous curve equations. You may have to play with the parameter a bit to get a sense of what it controls.
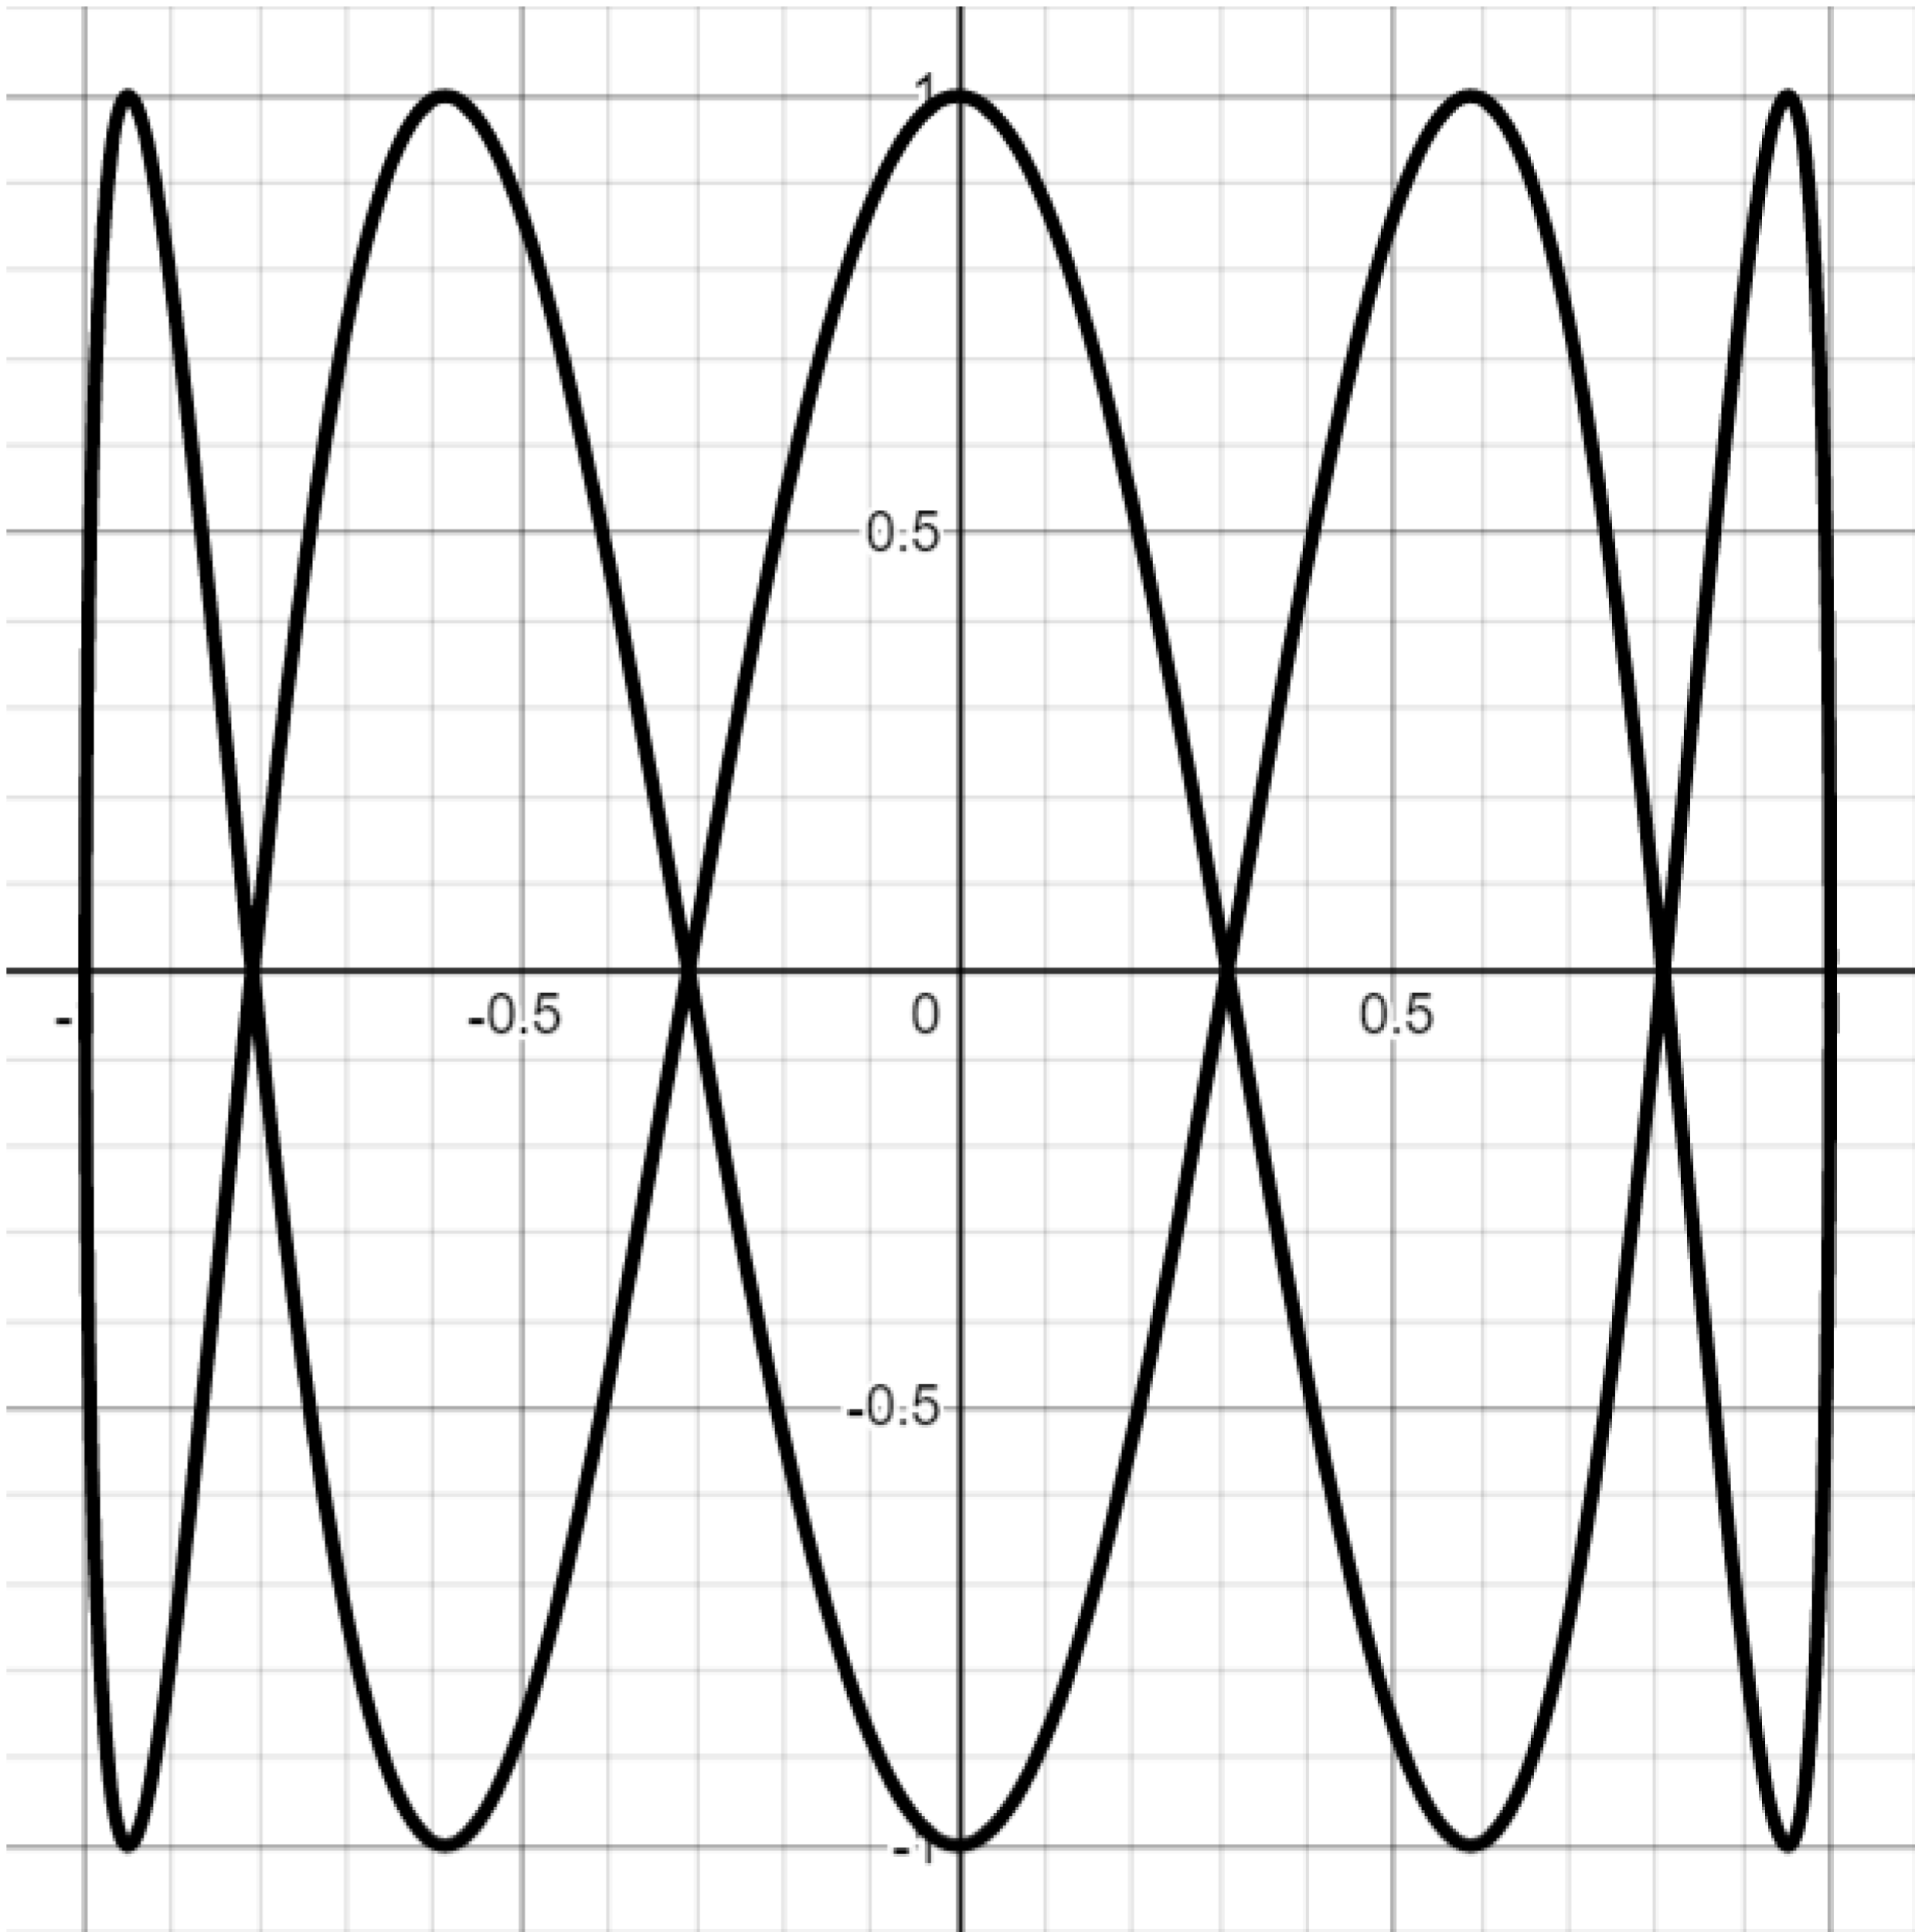
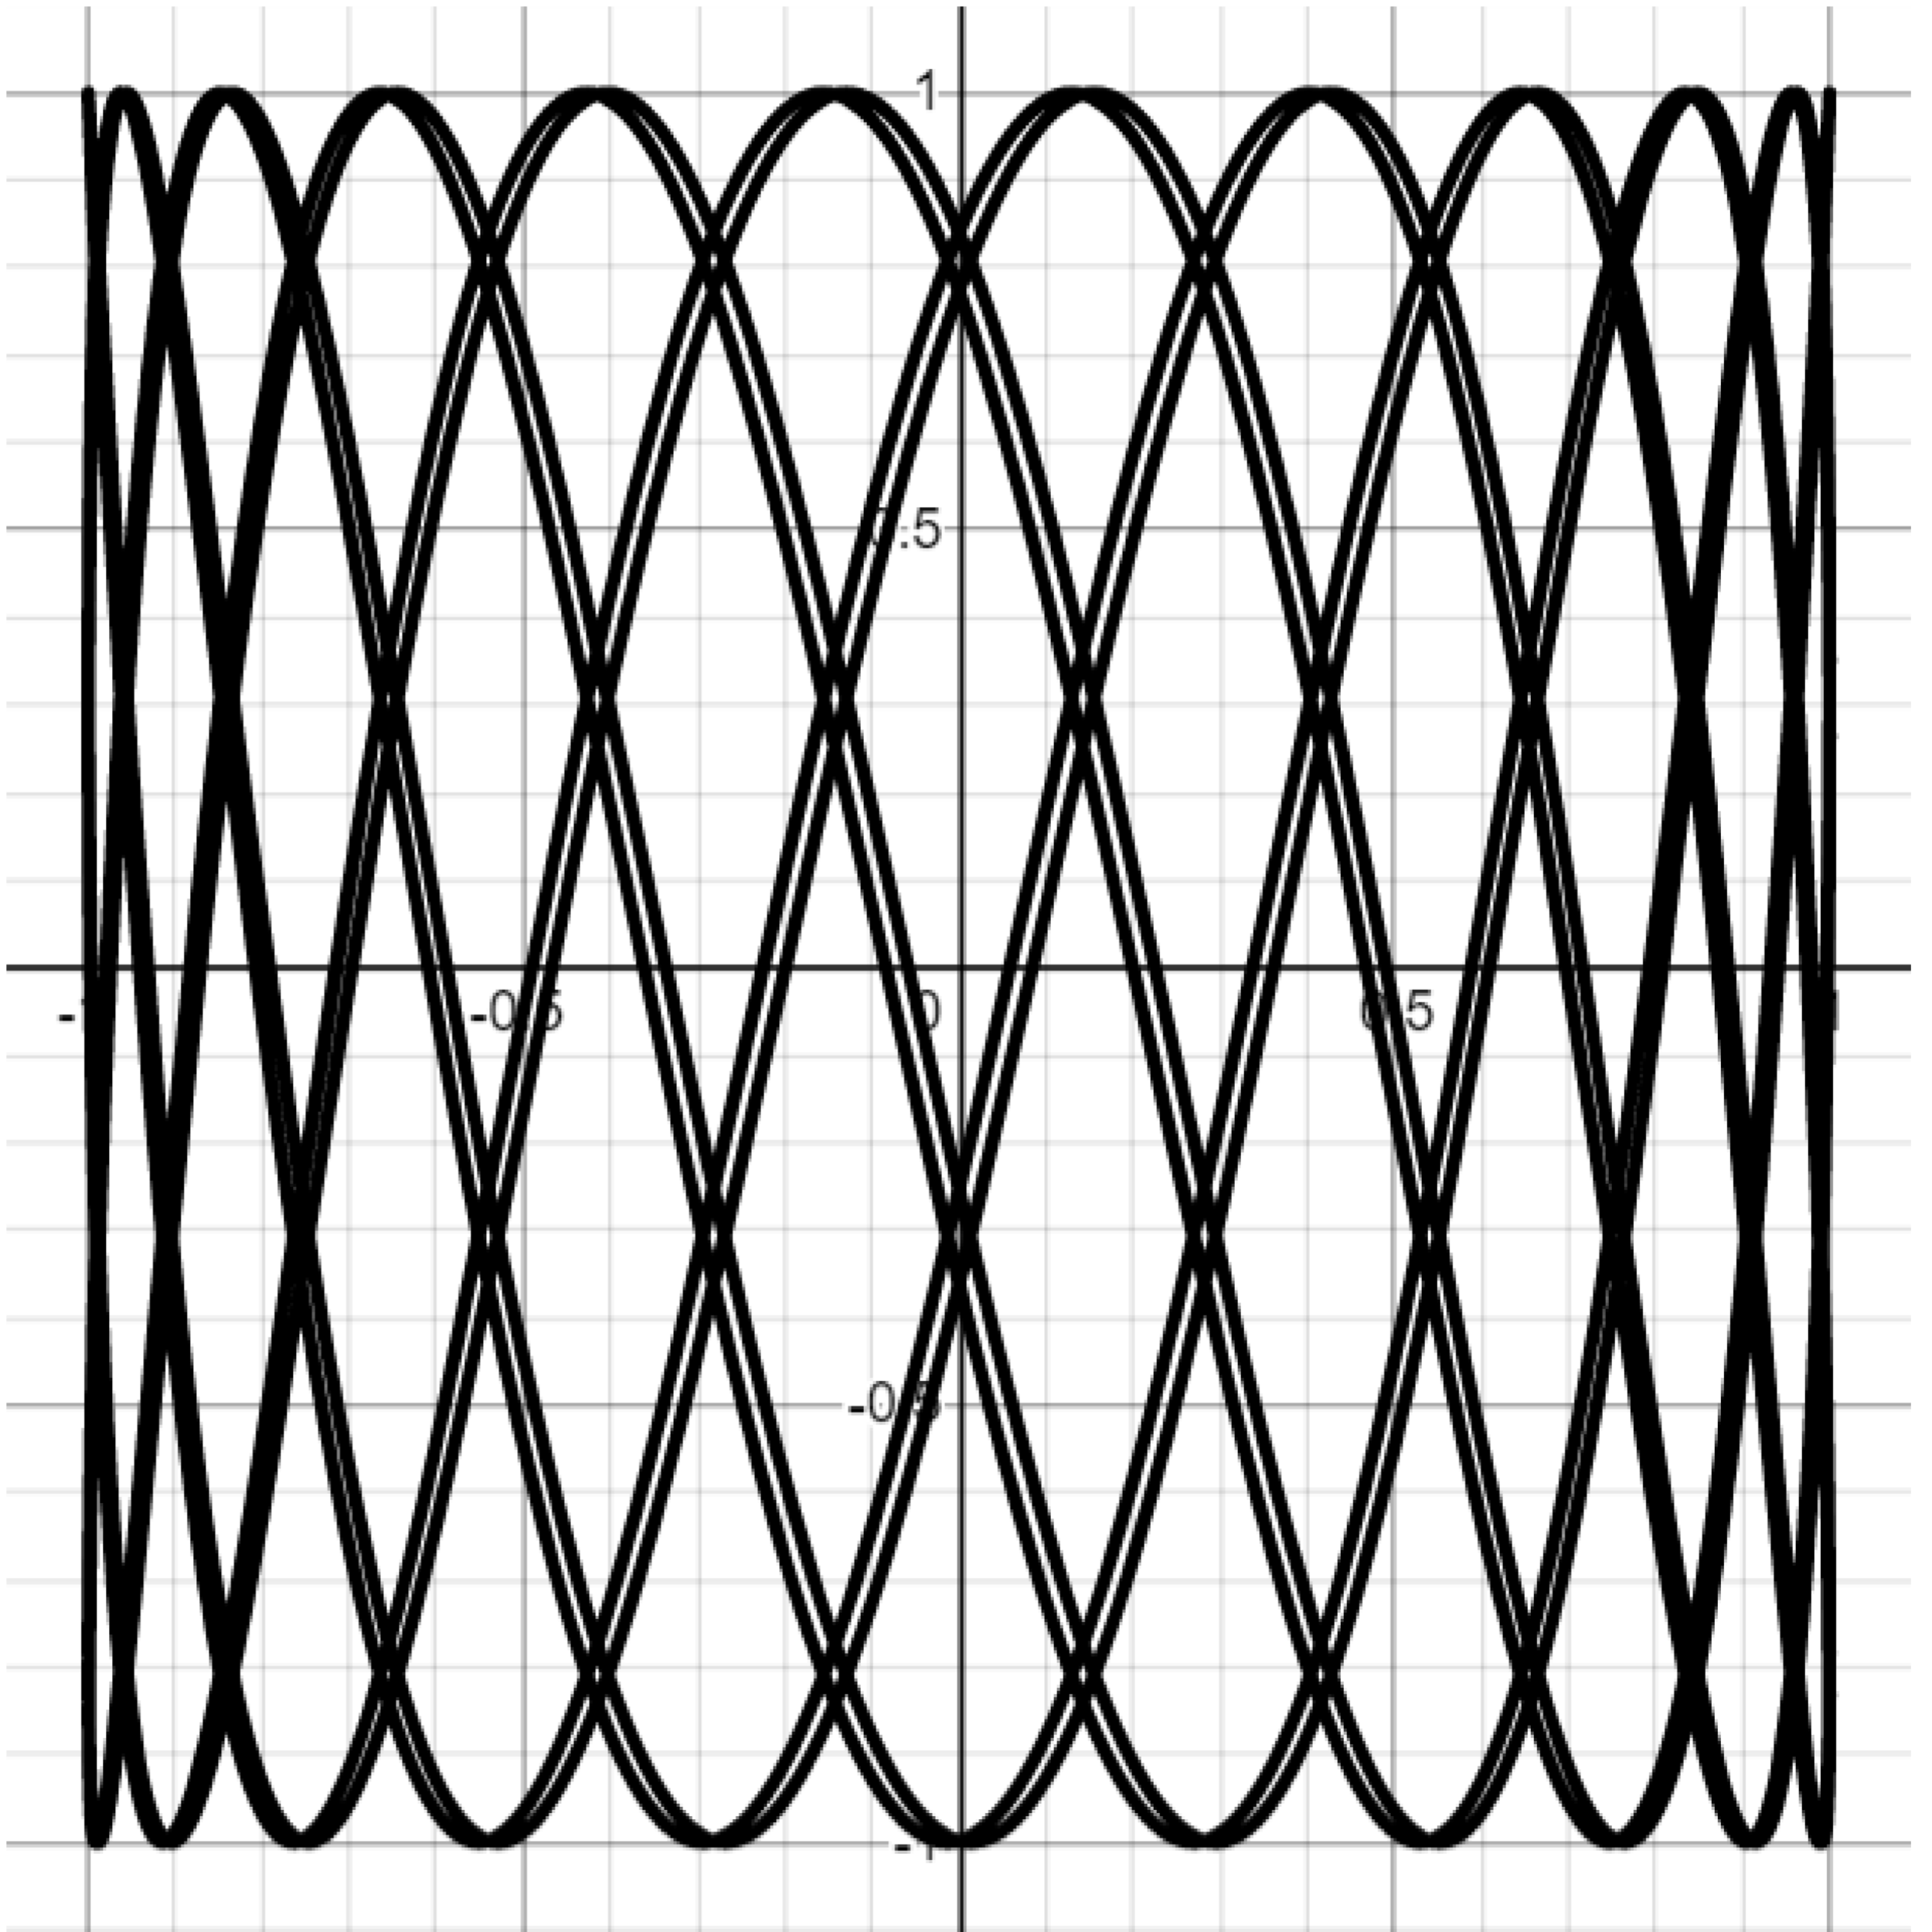
Challenge. Attempt to reproduce the Lissajous graphs below by setting $b=1$ and varying $a.$
This post is part of the book Graphing Calculator Drawing Exercises. Suggested citation: Skycak, J. (2019). Graphing Calculator Drawing: Lissajous Curves. In Graphing Calculator Drawing Exercises. https://justinmath.com/graphing-calculator-drawing-lissajous-curves/
Want to get notified about new posts? Join the mailing list and follow on X/Twitter.