Graphing Calculator Drawing: Horizontal and Vertical Lines
Horizontal and vertical lines can be used to draw a castle.
This post is part of the book Graphing Calculator Drawing Exercises. Suggested citation: Skycak, J. (2019). Graphing Calculator Drawing: Horizontal and Vertical Lines. In Graphing Calculator Drawing Exercises. https://justinmath.com/graphing-calculator-drawing-horizontal-and-vertical-lines/
Want to get notified about new posts? Join the mailing list and follow on X/Twitter.
Setup. Navigate to https://www.desmos.com/calculator. Be sure to sign in so that you can save your graph.
Demonstration - Vertical Lines. Observe the graph as you type each of the following inputs:
Demonstration - Horizontal Lines. Observe the graph as you type each of the following inputs:
Demonstration - Rays and Segments. Observe the graph as you type each of the following inputs:
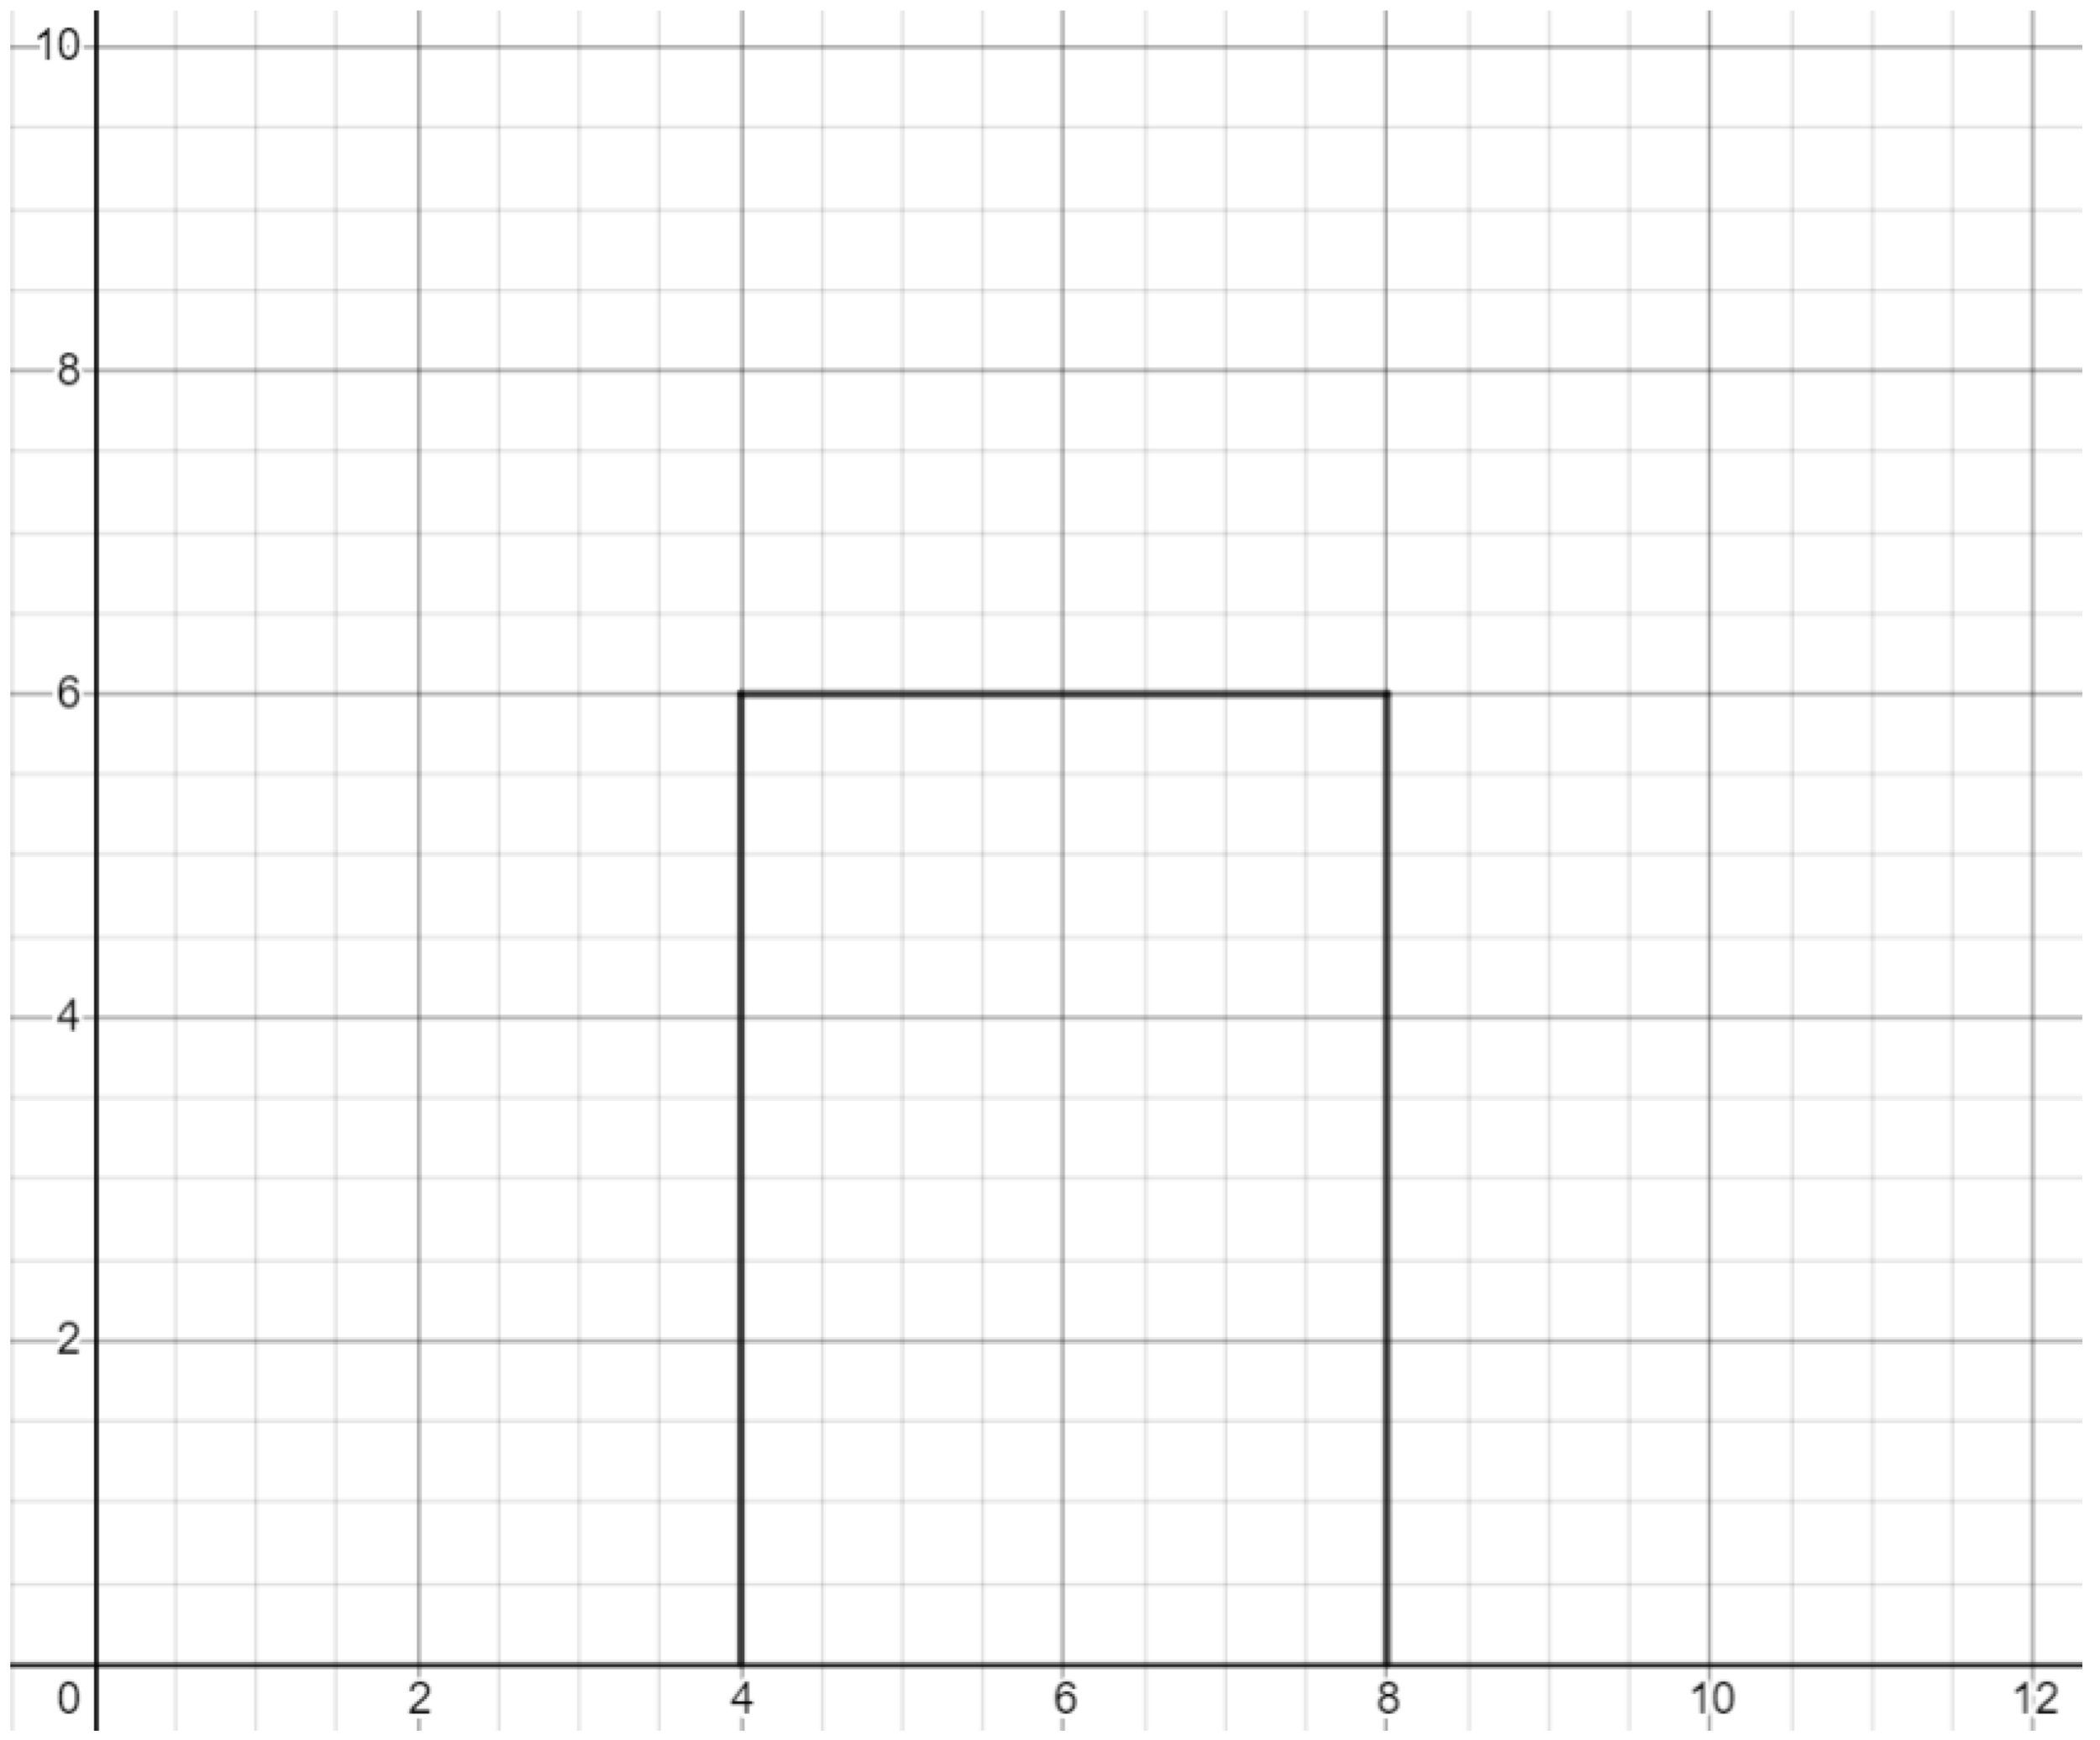
Exercise. Reproduce the graph below. (Note: you can change the line color by clicking and holding the colored circle to the left of the math input box.)
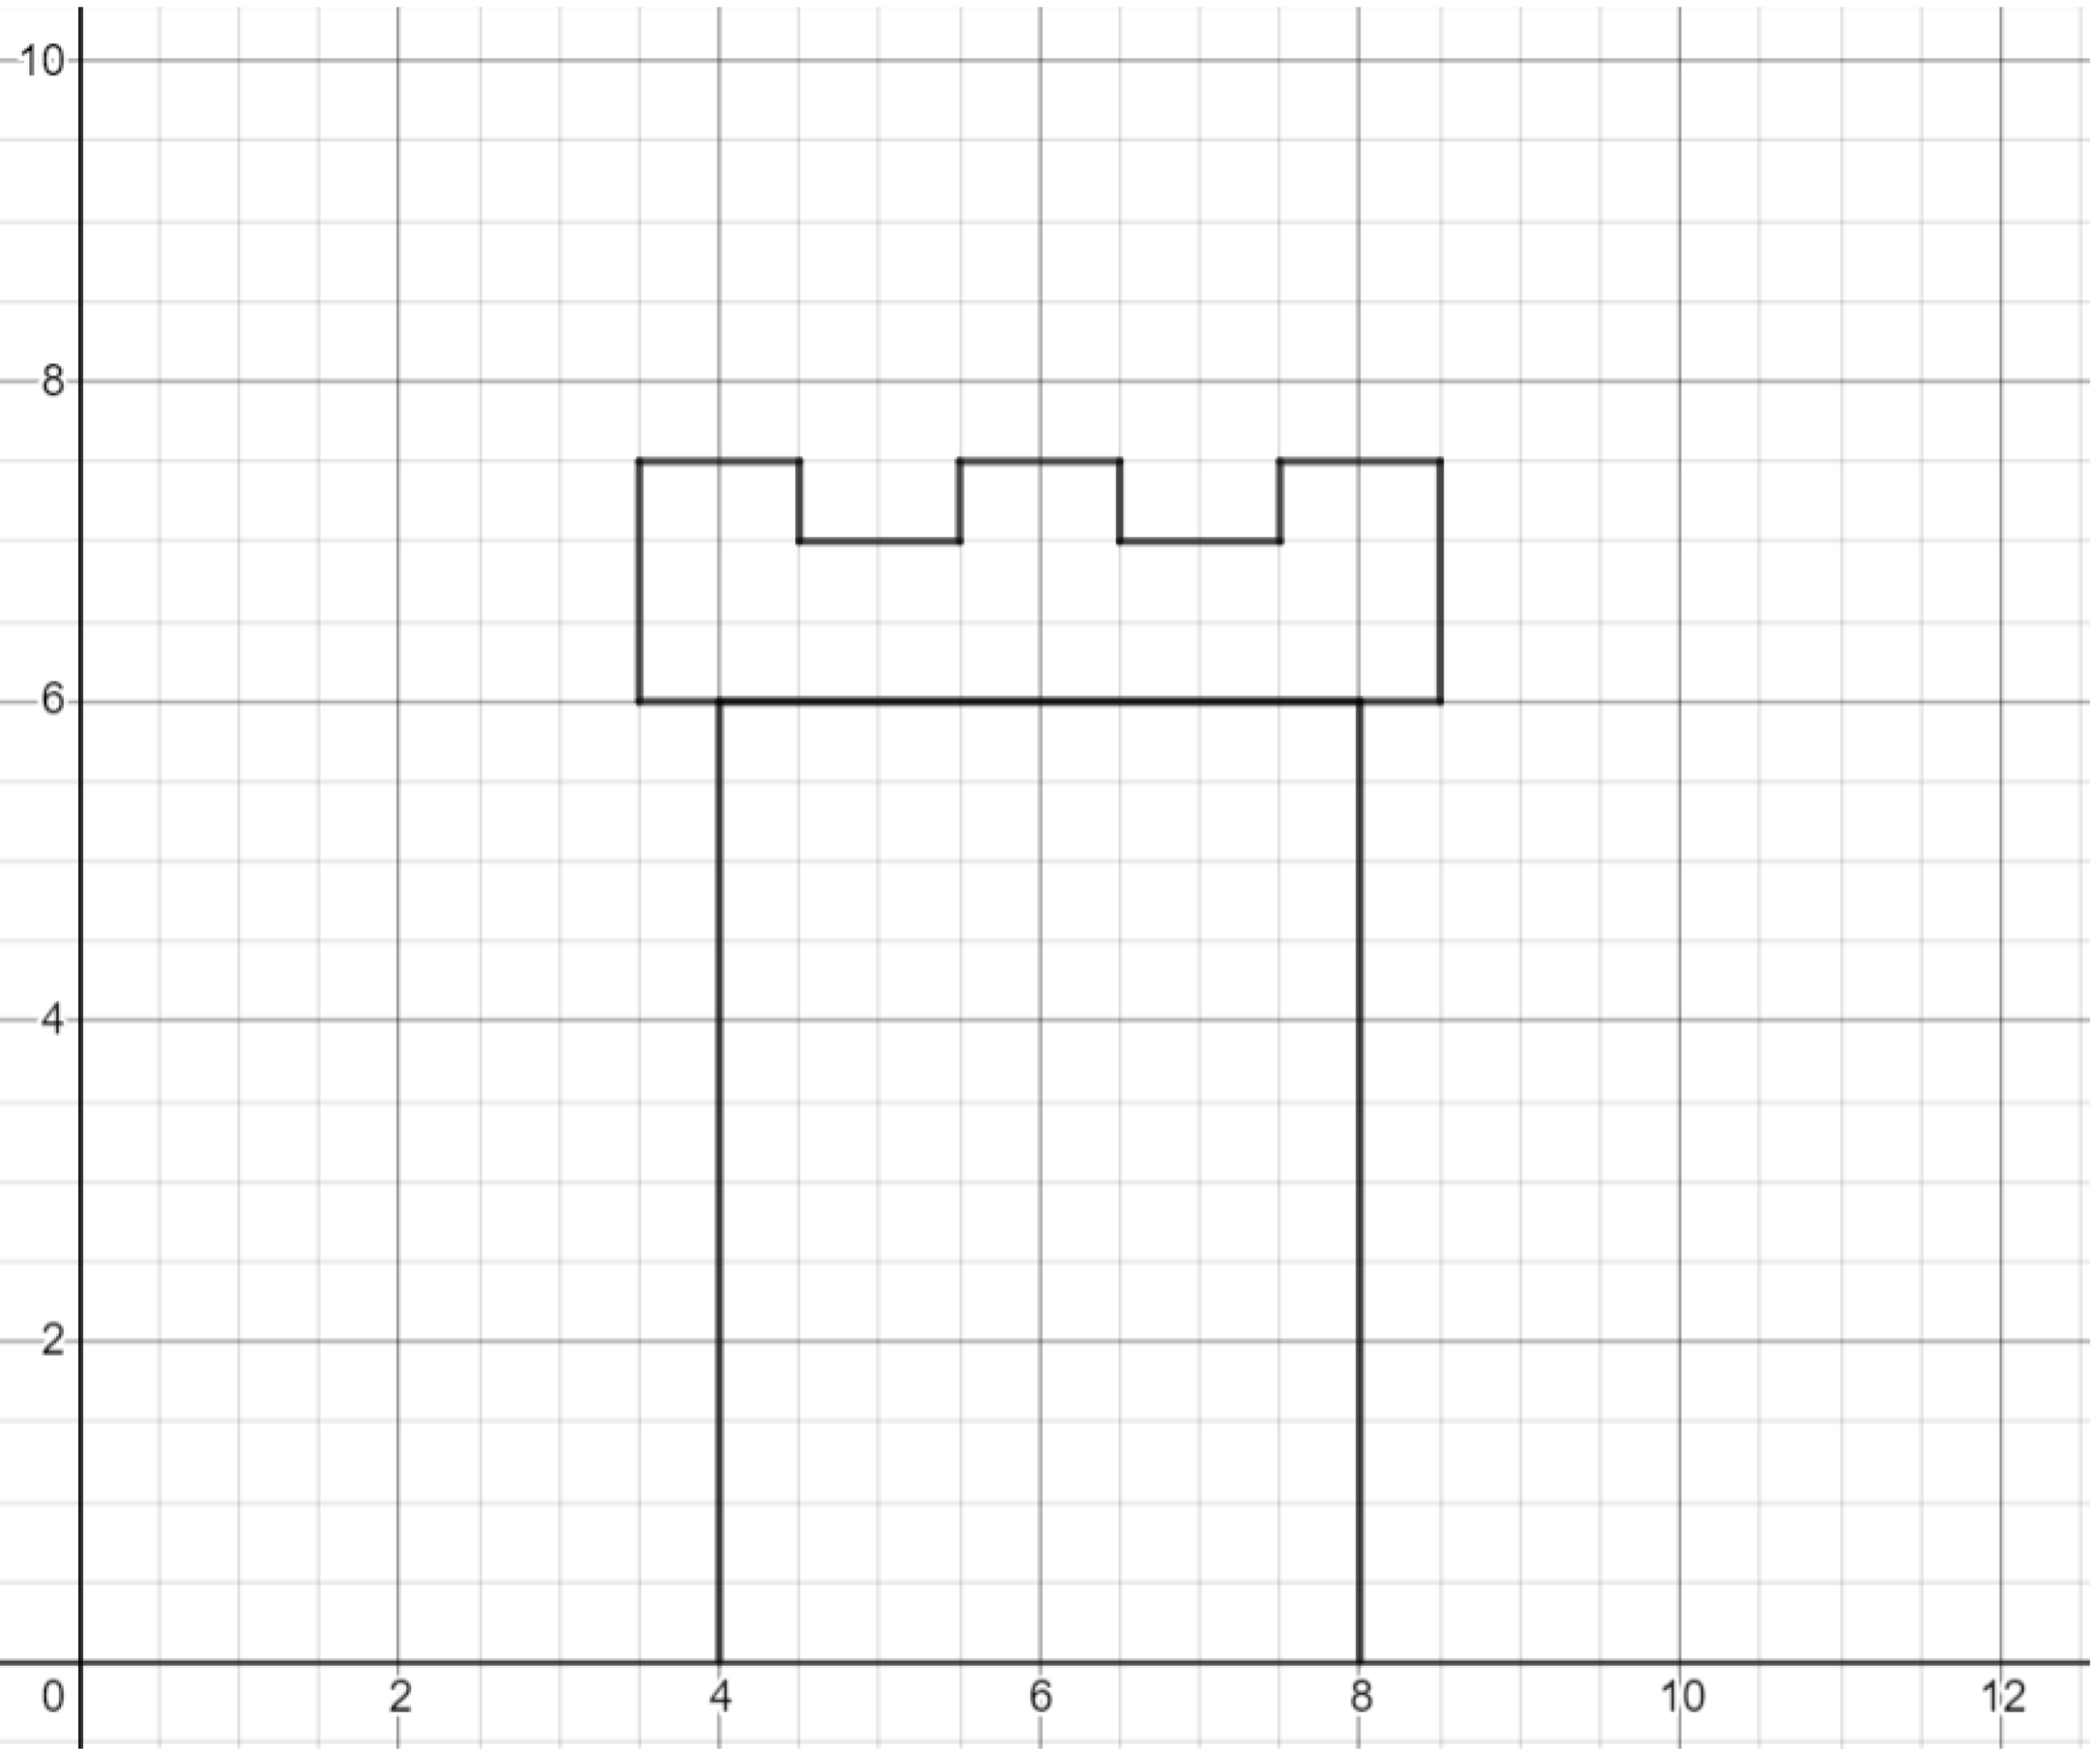
Exercise. Add ridges to the top of the graph you produced in the previous example.
Challenge. Draw a full castle!
This post is part of the book Graphing Calculator Drawing Exercises. Suggested citation: Skycak, J. (2019). Graphing Calculator Drawing: Horizontal and Vertical Lines. In Graphing Calculator Drawing Exercises. https://justinmath.com/graphing-calculator-drawing-horizontal-and-vertical-lines/
Want to get notified about new posts? Join the mailing list and follow on X/Twitter.